Blue Sapphires from the Baw Mar Mine in Mogok
ABSTRACT
In the last five years, fine Burmese blue sapphires from the Baw Mar area of Mogok have reached the market. The faceted stones typically show a strong pleochroism from greenish to violetish blue when viewed perpendicular and parallel to the c-axis, respectively, with medium to strong saturation and medium to dark tone. Most of the samples were relatively clean under the microscope, showing multiple twinning with whitish needle-like inclusions (presumably boehmite) at the intersections. Often, these inclusions were associated with stress tension fissures. Needles, most likely rutile, were found only occasionally, but small platelets and needle-like particles, probably ilmenite, appeared more frequently. Most of the stones contained surface-reaching open and healed fissures, but crystal inclusions of K-feldspar and mica (identified by Raman) were occasionally encountered. The sapphires also had a relatively high iron content, low gallium, and very low titanium. Their Ga/Mg ratio varied from 0.6 to 17. Their UV-Vis-NIR spectra displayed intense iron-related absorptions, and the FTIR absorption spectra presented mainly boehmite- and mica-related bands. Based on careful microscopic observations, combined with spectroscopic and chemical analysis, the sapphire from Baw Mar can, in most cases, be distinguished from the blue sapphire of other localities.
INTRODUCTION
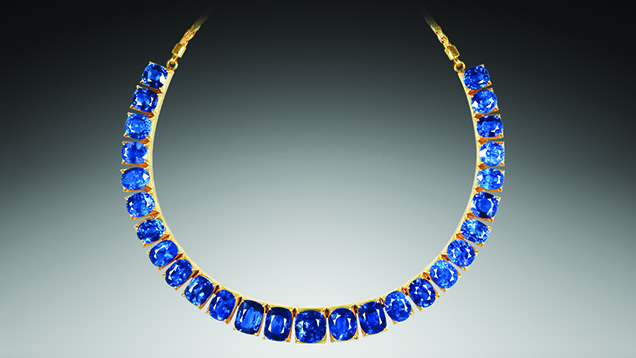
For several centuries, Burmese blue sapphires have been prized in the gemstone trade. Virtually all gem-quality blue sapphires from Burma (now Myanmar) have occurred in alluvial deposits along the Mogok Stone Tract. The previously described sapphires were mostly found at the Kyat Pyin area at Kyauk-Pyat-That, Kabaing, and Thurein-Taung (all west of Mogok) and at Chaung Gyee in the north of Mogok (Gübelin and Koivula, 1986; Kiefert, 1987; Hughes, 1997; Themelis, 2008; Smith, 2010). In the last five years, blue sapphires with properties different from the “classic” Burmese sapphires, reportedly from the Baw Mar area of Mogok, have reached the market (figure 1).
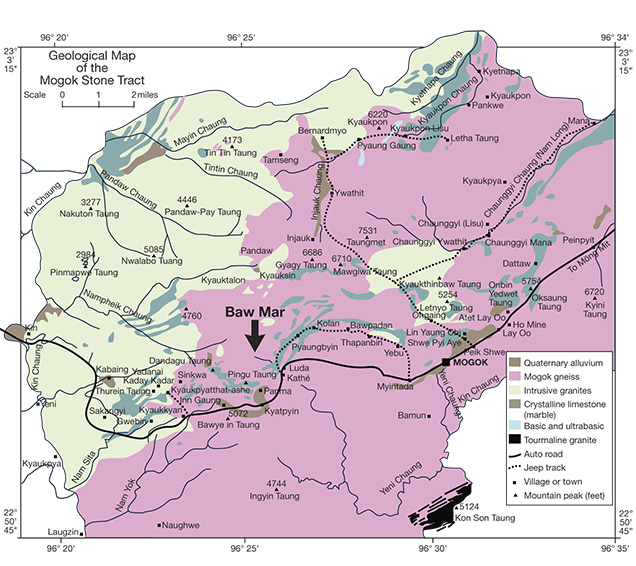
The Baw Mar mining area is situated in the Kyat Pyin area, west of Mogok township (figure 2). In the past, the area yielded mostly low-quality sapphire from small-scale operations. Although several joint venture mines were reportedly operating in 1994, they did not produce enough quality material to stay open for any length of time. Only since 2008 has the area produced larger amounts of gem-quality blue sapphires.
In late 2012, one of the authors visited Mogok to collect stones directly from Baw Mar and other mines for the Gübelin Gem Lab (GGL) reference collection. After the recent opening of Mogok to foreigners, a larger group of GGL staff visited the area again in July 2013 to gain a better picture of the situation and to collect additional samples directly from the source. In August, November, and December 2013, another author revisited Mogok and the Baw Mar mine, and observed the rapid changes taking place. This paper gives a brief overview of the local geology of the Baw Mar area, describes the mining methods currently used, and presents the microscopic, chemical, and spectroscopic features of its blue sapphire.
GEOLOGY AND CURRENT MINING METHODS
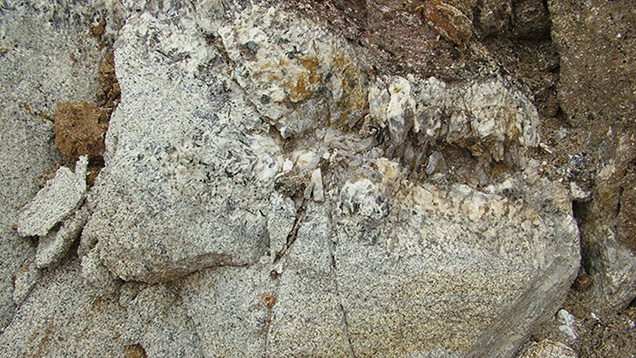
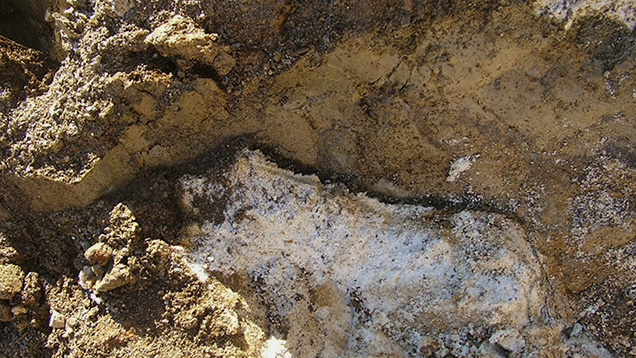
The Baw Mar mining site is situated in the northwest of Kyat Pyin township, 12 miles west of Mogok, at 22°54′37.60″N, 96°24′55.02″E. Similar to the rest of the Mogok Stone Tract, the area has a complex geology (figure 2). It is mainly composed of high-grade regionally metamorphosed rocks, garnet-biotite gneiss, calc-silicate rocks, and graphite marble (Kyaw Thu, 2007). Non-sapphire-bearing leucogranite dikes and granitic pegmatite veins intruded into weathered gneiss, which can be seen at ground level in exposed rock surfaces (figure 3). The recently mined area also shows exposed leucogranite in contact with syenite boulders. The high-quality blue sapphire is retrieved from this syenite, which, like the pegmatite, has intruded into weathered gneiss, as well as from pockets formed at the exposed leucogranite. These last sapphires are embedded in clay lenses (feldspar altered to kaolinite) and are surrounded by biotite mica and chlorite (figure 4). Prospecting is done by local geologists.
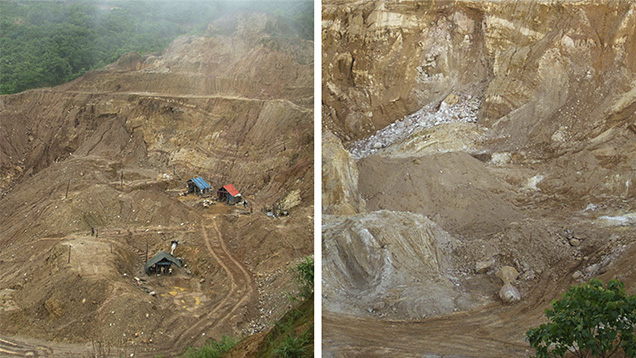
The Baw Mar mine (figure 5), equipped with heavy machinery and an in-house sorting and cutting plant, is a more efficient producer than other private operations within the Mogok mining area. The Baw Mar mine combines open-pit mining, as in figure 5 (top), with tunneling. A 10–20 meter layer of overburden is removed by bulldozers and excavators (figure 6, left). Laborers work the exposed gemstone-bearing layer of gravel, called byone, which is about 2 to 3 meters thick. The gravel is then transported by water to the washing plant (figure 6, right).
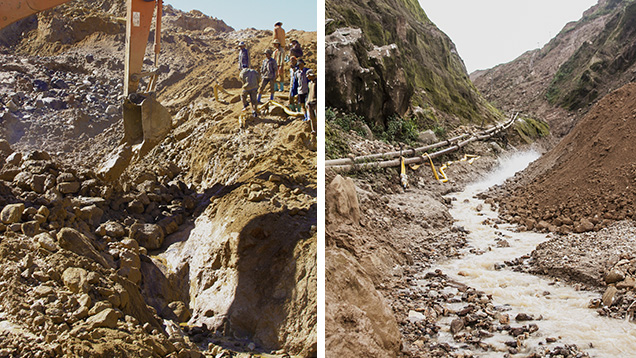
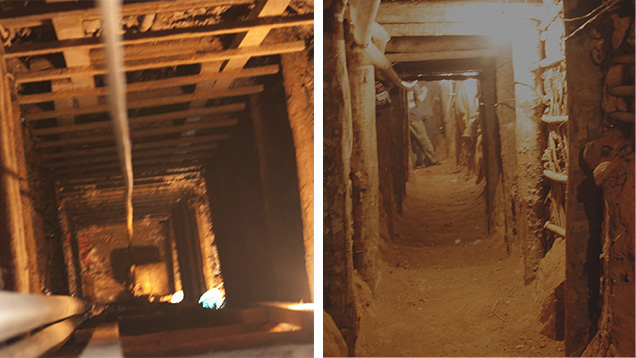
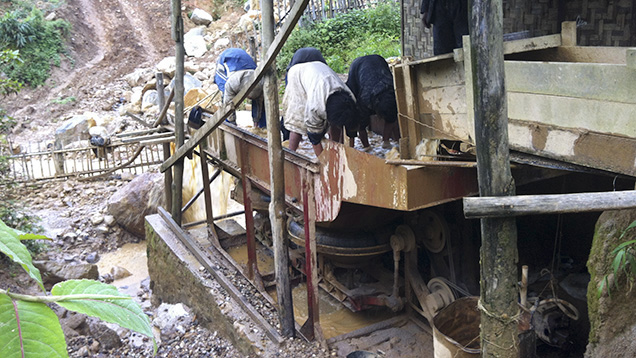
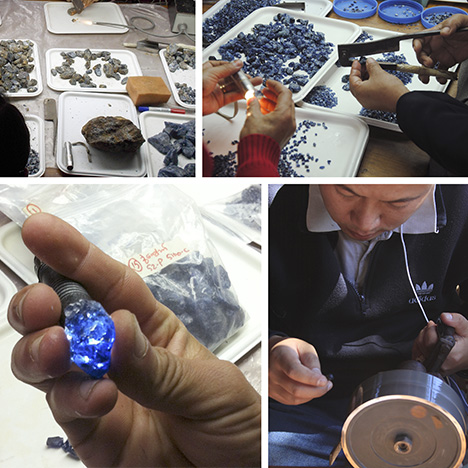
At the end of the tunnels, which can reach a depth of 80 meters (figure 7), miners use a drill to bore small holes in the rock face, and then crack the weathered rock in between the holes with a jackhammer to collect the material. The rock is relayed in bags to other miners. The material is hoisted to the surface, then transported down to the washing plant. Water pumps powered by generators simultaneously keep the tunnels from flooding and supply the washing operation. At the washing plant (figure 8), the collected gem-bearing gravels are packed into drums and transported to the sorting plant, where the gem-quality sapphires are sorted using sieves with different mesh sizes. Afterward, cutters trim off the non-gem-quality parts. The sapphires are then cut and polished onsite (figure 9). The polished sapphire sizes range up to 15 carats. The entire operation, including mining, sorting, and cutting, employs about 300 miners and workers.
MATERIALS AND METHODS
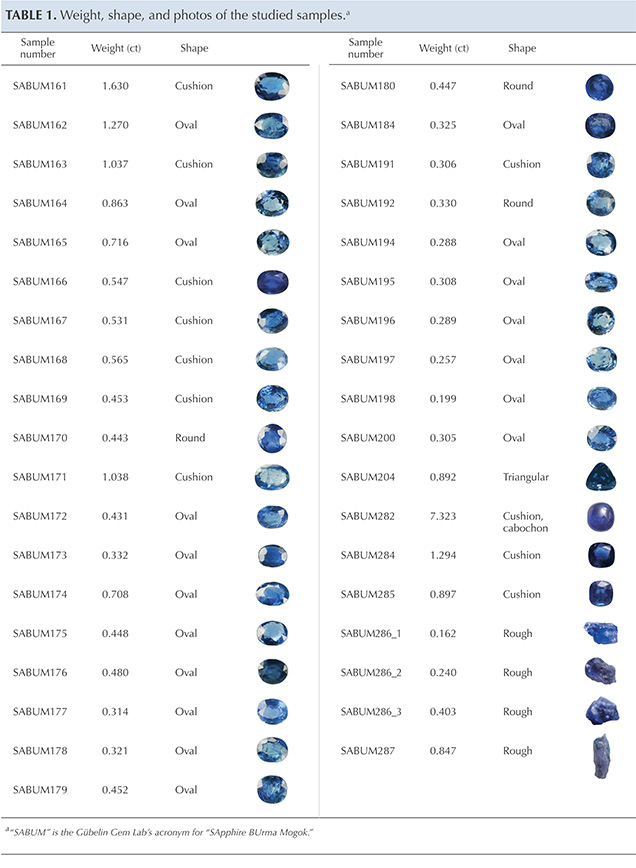
For the initial study, 30 unheated and faceted blue sapphires, ranging in size from 0.20 to 1.63 ct, were analyzed (table 1). One of the authors obtained the faceted samples directly from the miners at the source. Additional samples, including two faceted sapphires (SABUM284 and SABUM285), a 7.32 ct cabochon (SABUM282), and a rough sapphire lot, were collected from the mining operation for confirmation of the initial data. The rough material was gathered directly from the washing plant by the authors. Four rough sapphires were ultimately used in this study, ranging in size from 0.16 to 0.84 ct (SABUM286_1, SABUM286_2, SABUM286_3, and SABUM287).
Standard gemological instruments were used to observe the samples’ long- and short-wave UV fluorescence reactions (6W lamps emitting at 365 and 254 nm, respectively) and to measure their refractive index, birefringence, and pleochroism. Specific gravity was determined hydrostatically with an electronic balance. Internal features were examined using various gemological microscopes.
Energy-dispersive X-ray fluorescence (EDXRF) analyses were carried out at GGL with a Thermo Scientific ARL Quant’X. Sample holders with an aperture of 5 mm diameter were used, and specific sets of parameters were optimized for the most accurate analysis of corundum. Various conditions were used for filters and voltage (no filter/4 kV, cellulose/8kV, aluminum/12kV, thin palladium/16 kV, medium palladium/20kV, thick palladium/28kV, and thick copper/50kV), with an acquisition time of about 40 minutes for each sample. Twelve samples were analyzed by laser ablation–inductively coupled plasma–mass spectrometry (LA-ICP-MS). All analyses were performed on a Perkin Elmer ELAN DRC-e single collector quadrupole mass spectrometer combined with a 193 nm ESI Excimer gas laser ablation system. A set of three single-spot analyses (120 μm diameter) was collected on each sample using a laser frequency of 10 Hz and an ablation time of 50 seconds at a laser energy of 6.2 J/cm2. The mass spectrometer performance was optimized to maximum intensities at U/Th ratios of ~1 and ThO/Th less than 0.3 using 16.25 liters per minute (L/min) Ar plasma gas, 0.88 L/min argon as nebulizer gas and 1 L/min helium as sample gas. Multi-element NIST610 was the glass standard used for external calibration; internal calibration was done by normalizing to 100% cations of stoichiometric corundum. The data reduction was carried out using an in-house spreadsheet following Longerich et al. (1996).
Polarized absorption spectra in the 200–1500 nm range were recorded using a Cary 5000 ultraviolet/visible/near-infrared (UV-Vis-NIR) spectrometer with diffraction grating polarizers. The data sampling interval and spectral bandwidth of each measurement were set at 0.5 nm and a scan rate of 150 nm/min. FTIR absorption spectra were acquired between 6000 and 400 cm–1, using a Varian 640 FTIR spectrometer with 4 cm–1 resolution and 64 scans (background spectra were collected using the same parameters). A Renishaw Raman System 1000 spectrometer, coupled with a Leica DMLM optical microscope, was used to characterize accessible inclusions. Unpolarized and unoriented spectra were recorded using 514 nm argon ion laser excitation at 10 mW in standard mode (with 20× magnification), from 200 to 2000 cm–1 (three cycles with an acquisition time of 30 seconds) at approximately 1.5 cm–1 resolution. Rayleigh scattering was blocked by a holographic notch filter; the backscattered light was dispersed on an 1800 groove/mm holographic grating with the slit width set at 50 μm.
RESULTS AND DISCUSSION
Most of the samples were pleochroic, from greenish to violetish blue, with medium to strong saturation and medium to dark tone. With the exception of the less saturated sapphires, the samples exhibited their deeper blue pleochroic color parallel to the c-axis (o-ray). Consistent gemological properties included RI (nα=1.760–1.764, nγ=1.768–1.772), birefringence (0.008), and SG (3.96–4.01). All samples were inert to long- and short-wave UV radiation.

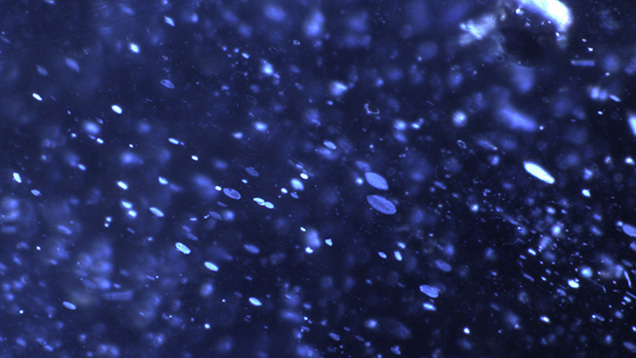
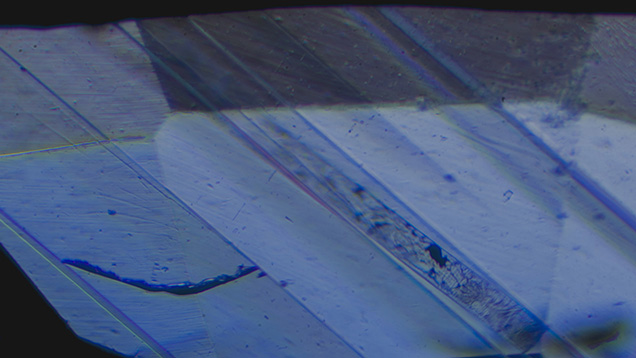
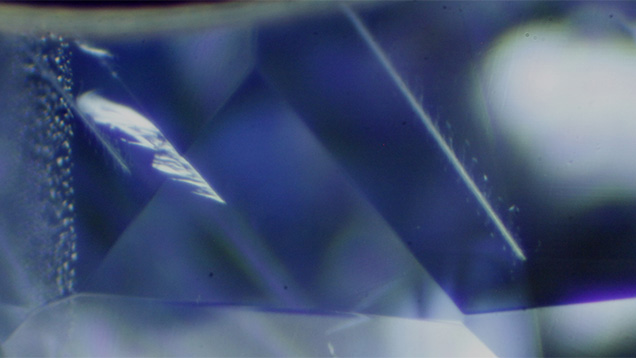
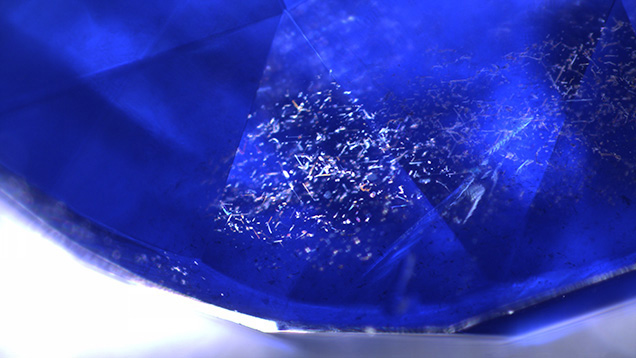
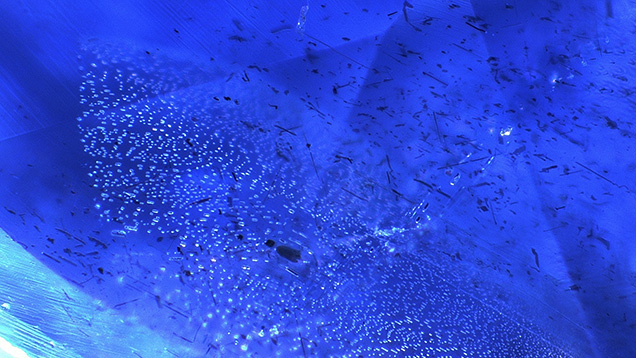
Microscopic observation demonstrated that the samples were relatively free of inclusions, occasionally showing strong polysynthetic twinning (as in figure 10), in two or three directions parallel to the rhombohedral face r {1011}. The twinning is associated with parallel “needle-like” deposits, presumably of boehmite, at the intersections of two sets of twin planes, or in three directions nearly perpendicular to each other when three sets of twin planes were present, often associated with small fissures along these “needles” (figure 11). Also observed were even color zoning; healed fissures consisting of fine negative crystals that can be seen in figure 12; fine reflective platelets (figure 13); brownish irregular needles, as in figures 14 and 15, that are presumably ilmenite; and only rarely a few short needles, exhibited in figure 15, that are most likely rutile. Seldom were crystal inclusions observed; sample SABUM285, shown in figure 16, is such an example. The samples often showed reflective open fissures as well as open fissures with epigenetic material, as seen in figure 17. Unlike Mogok sapphires described in the past, where rutile needles and crystal inclusions such as zircons, apatite, plagioclase, and phlogopite mica are often encountered (Gübelin and Koivula, 1986; Kiefert, 1987; Hughes, 1997; Themelis, 2008; Smith, 2010), only a few samples from Baw Mar contained short rutile needles and crystal inclusions. Using Raman spectroscopy, these inclusions were identified as mica and K-feldspar (see Tlili et al., 1989 and Freeman et al., 2008, respectively).
EDXRF chemical analysis of the major and minor elements of 30 samples revealed Fe between 1000 and 6800 ppmw, with an average of 4400 ppmw. Ga ranged between 45 and 180 ppmw, with an average of 110 ppmw. The Ti values were relatively low, from below EDXRF’s detection limit (in nine samples) to 140 ppmw, with an average of 30 ppmw. All other measured elements (V, Cr, Mg, Mn, Nb, Zr, Sn, and Pb) were below detection limit (bdl). LA-ICP-MS analysis of 12 samples revealed 57Fe from 900 to 4500 ppmw, 71Ga from 35 to 115 ppmw, 49Ti from 15 to 115 ppmw, 25Mg from 5 to 80 ppmw, and 51V from 0.5 to 50 ppmw. All the other measured elements (7Li, 8Be, 44Ca, 45Sc, 59Co, 62Ni, 65Cu, 66Zn, 73Ge, 85Rb, 88Sr, 89Y, 90Zr, 93Nb, 118Sn, 133Cs, 137Ba, 139La, 140Ce, 181Ta, 182W, 195Pt, and 232Th) were bdl. The 53Cr, 55Mn, 23Na, and 208Pb levels were also generally bdl and rarely slightly above. The Ga/Mg ratio was used to differentiate blue sapphires of different geological origin. For example, Ga/Mg greater than 10 suggests “magmatic” origin, whereas Ga/Mg less than 10 suggests “metamorphic” origin (Peucat et al., 2007). Within the studied samples, the Ga/Mg ratio varied from 0.6 to 17; this further confirms the complicated geological origin of the blue sapphires from this area. Slight differences between the element concentrations measured with EDXRF and LA-ICP-MS are probably due to different measurement areas (smaller for LA-ICP-MS), different detection limits (much lower detection limit for LA-ICP-MS), as well as some inclusion effects.
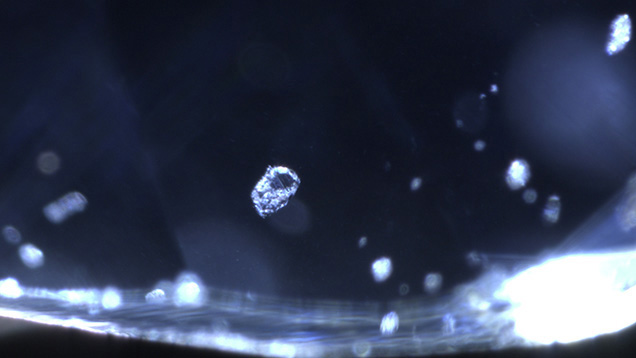
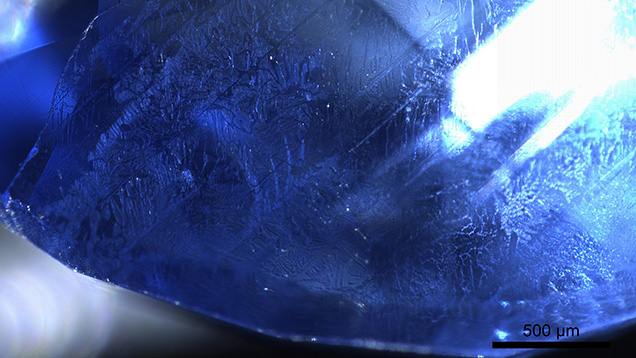
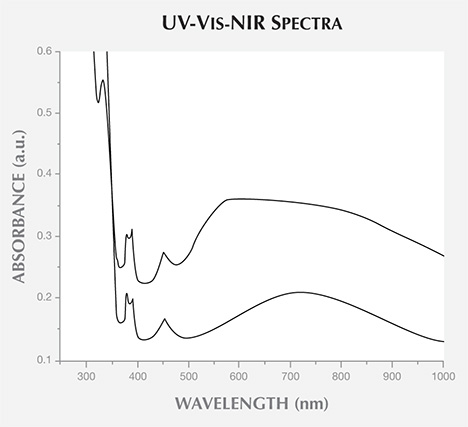
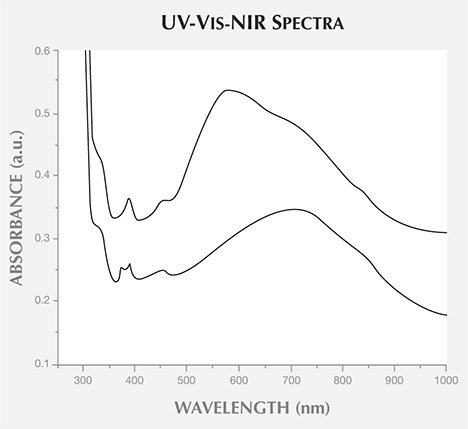
Figure 18 shows polarized UV-Vis-NIR spectra in the 250–1000 nm range for sample SABUM282. Most other samples presented very similar spectra. We observed the Fe3+-related series of bands in the violet and blue areas of the spectrum, between 370 and 490 nm, which had relatively high intensity (Ferguson and Fielding, 1971; Eigenmann et al., 1972; Schmetzer, 1987). A cutoff above 300 nm and an intense shoulder in the UV region at around 340 nm were also observed. The larger samples showed a cutoff at around 340 nm, because the iron-related feature there saturated the spectrophotometer detector due to the longer beam path. The large bands absorbing from green to the near-infrared were due to Fe2+-Ti4+ and Fe2+-Fe3+ pairs (Ferguson and Fielding, 1971; Schmetzer, 1987). All the samples showed similar spectra. Unlike classic Burmese sapphires, the samples from Baw Mar contain high Fe3+ UV-Vis absorption peaks in the violet and blue; most also show an intense shoulder in the UV region at ~340 nm, as seen in figure 19 (Hänni, 1994). The intensity of Fe2+/Fe3+ bands situated in the near-infrared area varies greatly, and can in some cases be mistaken for the spectra of basaltic sapphires (Kiefert, 1987).
Unpolarized FTIR spectra of some samples present multiple series of bands above 3000
cm–1, probably due to hydrous mineral inclusions such as mica and boehmite (Smith, 1995;
Beran and Rossman, 2006). Many of the samples we studied did not show bands in this region,
however. Raman spectra of the few rare crystal inclusions observed were consistent with mica
and K-feldspar.
CONCLUSION
Blue sapphires collected from the Baw Mar mine in Mogok showed properties distinctly different from those associated with “classic” Mogok blue sapphires. The Baw Mar samples, which are formed in syenite which intruded into weathered gneiss, as well as from pockets formed at the exposed leucogranite, typically exhibit greenish to violetish blue colors. They are often free of inclusions, sometimes with twinning in multiple directions and needles (most likely boehmite) at the intersections of the twin planes. They also exhibit small platelets, healed and open fissures, irregular needles that are most likely ilmenite and, rarely, short needles that are probably rutile. The few crystal inclusions were identified as K-feldspar and mica by micro-Raman analysis. Their UV-Vis-NIR spectra are different from the inclusions of classic Mogok blue sapphires, with high iron-related bands; as a result, they are sometimes confused with basaltic blue sapphires. Chemical analysis also shows relatively high iron, low gallium, very low titanium contents, and Ga/Mg ratios that strongly vary from sample to sample. The presence of boehmite and mica bands is confirmed by FTIR. Additional research is underway on the Baw Mar sapphire geological formation, as well as on classic Burmese blue sapphires and similar-looking material from other mines worldwide. This research will shed further light on the positive identification of samples from this mine, as well as increase understanding of the differences observed in blue sapphire from other localities.


