Colored Stones and Pearls

3D Reconstruction of the Internal Structures of Pearls
Emiko Yazawa and Chunhui Zhou
GIA, New York
Pearl testing involves a variety of tools and techniques, most notably X-ray imaging. GIA applies both real-time X-ray microradiography (RTX) and computed X-ray microtomography (μ-CT) to reveal the internal structures of pearls and draw conclusions on their identity. These images help gemologists determine whether a pearl is natural, bead-cultured, non-bead cultured (NBC), and so forth. The identification of some pearls remains challenging for even the most well-equipped laboratories. Researchers sometimes find surprises hidden within—a piece of shell or some other interesting object that is difficult to visualize with two-dimensional images.
Here, we present a range of interesting internal three-dimensional structures (figure 1), using specialized software and μ-CT slice images for the reconstruction. These include unusual internal growth features such as bivalve and gastropod shells, foraminifera, flower-shaped bead nuclei, and plastic bead nuclei, as well as non-bead-cultured features such as voids and linear structures. This powerful research tool makes it possible to virtually explore, manipulate, extract, and reconstruct specific areas inside a pearl for analysis. It also gives the operator the ability to enhance the existing μ-CT data to view the details more clearly, thus revealing the fascinating world within pearls that gemologists routinely encounter.
Atypical “Bead”-Cultured Pinctada Maxima Pearls Nucleated with Freshwater Non-Bead-Cultured Pearls
Promlikit Kessrapong and Kwanreun Lawanwong
GIA, Bangkok
At present, most of the freshwater shell bead nuclei used in the cultured pearl industry originate from mussels from the Mississippi River in the United States. However, shell beads are not the only material used as nuclei in the culturing process. Cultured freshwater pearls have also been used as nuclei to produce atypical bead-cultured (aBC) South Sea pearls (Scarratt et al., 2017).
GIA researchers sourced several aBC samples from Orient Pearl Ltd. in Bangkok. Two samples were selected, one “golden” and one white (figure 1), both showing an unmistakable saltwater appearance. Standard testing methods as well as macro photography, microradiography, X-ray luminescence (Hänni et al., 2005; Kessrapong et al., 2017), Raman and photoluminescence (PL) spectroscopy and ultraviolet-visible spectrophotometry (UV-Vis) were applied to the samples prior to cutting them in half. After they were sawn, further data was collected through photomicrography, X-ray fluorescence (XRF) images, and laser ablation–inductively coupled plasma–mass spectrometry (LA-ICP-MS) analysis.

As expected, the results of the examination confirmed their aBC nature. While their appearance, baroque shapes, and white to strong yellow (golden) colors indicated they were typical saltwater Pinctada maxima pearls, their internal structures revealed clear boundaries where the outlines of freshwater NBC pearl nuclei could be seen in the microradiographs. Raman, PL, and UV-Vis spectra for the golden sample indicated it formed within a P. maxima mollusk. Also, in keeping with their freshwater NBC nuclei structure, a weak to moderate fluorescence was observed, which would not be the case to such a degree if they were entirely saltwater in origin. The golden pearl showed a yellow-orange fluorescence to X-ray luminescence, while the white sample exhibited a yellow-green reaction, similar to the result one would expect to see in cultured saltwater pearls incorporating freshwater mussel shell nuclei.
Examining the halves, we observed more detail: the demarcation between the two parts (nuclei and surrounding nacre overgrowth), small void/linear features (proving the NBC origin of the nuclei), the different colors/structures between the saltwater and freshwater nacre components, and some other indications of their cultured origin (i.e., small voids within the demarcation zones). The X-ray luminescence reactions were similar to those seen in the whole samples, only more intense since the inner freshwater nuclei were now directly exposed to the X-rays and not masked by the saltwater nacre that covered them prior to cutting. LA-ICP-MS analysis clearly revealed the nature of the outer saltwater layers and inner freshwater pearls, through significant differences in the concentrations of Sr and Mn among other elements. The Mn levels in the center were higher while the Sr levels were lower compared to the overgrowth layers, where the opposite was true, as expected in saltwater material.
Although cutting the pearls in half was a nice way to reveal the features in more detail, it is worth noting that gemologists do not need to go to such extremes to prove the identities of such pearls in laboratory conditions. Standard testing methods permit the straightforward identification of aBC pearls. Cutting them in half is a useful exercise to carry out for scientific examination of their structures and to allow more detailed analysis that would not otherwise be possible.
REFERENCES
Hänni H.A., Kiefert L., Giese P. (2005) X-ray luminescence, a valuable test in pearl identification. Journal of Gemmology, Vol. 29, No. 5/6, pp. 325–329.
Kessrapong P., Lawanwong K., Sturman N. (2017) Pinctada maculata (pipi) bead-cultured blister pearls attached to their shells. GIA Research & News, Apr. 25, https://www.gia.edu/gia-news-research/pinctada-maculata-bead-cultured-blister-pearls-shells
Scarratt K., Sturman N., Tawfeeq A., Bracher P., Bracher M., Homkrajae A., Manustrong A., Somsa-ard N., Zhou C. (2017) Atypical “beading” in the production of cultured pearls from Australian Pinctada maxima. GIA Research & News, Feb. 13, https://www.gia.edu/gia-news-research/atypical-beading-production-cultured-pearls-australian-pinctada-maxima
Chinese Freshwater Cultured Pearl Industry at a Crossroads
Qishen Zhou and Ren Lu
Gemmological Institute, China University of Geosciences, Wuhan
During the past 15 years, China has made tremendous progress in the quality and output of freshwater cultured pearls (see figure 1). Innovative technologies have facilitated a variety of colors and high-quality nacre within a shorter culturing cycle. Large-scale culturing has boosted the annual output to a high of 2,200 tons, and China has become an undisputed freshwater pearl empire.
However, the expanded production has been accompanied by considerable damage to the environment. With a more forceful implementation of the Chinese government’s environmental policy, there have been many strict bans in the main producing areas of freshwater cultured pearls during the past three years. The pearl culturing area decreased from approximately 250 km2 in 2005 to 100 km2 in 2016, and output has also dropped from a peak annual output of over 2,200 tons to less than 1,300 tons in 2017. Production is predicted to decline by about 50 percent in the next year or two.
The number of Chinese lakes with Grade IV–V water quality (Grade IV water is used in general industrial and recreational water areas and Grade V water is employed in agricultural and general landscape water areas; see New York Water Quality Standards, 2016) increased from 16.67% in 2000 to 58.5% in 2016. It is worth emphasizing that about 20% of all lakes are still Grade V. At the same time, water eutrophication has become a common phenomenon. It is caused by the discharge of excess nutrients (mainly nitrogen and phosphorus), resulting in abnormal reproduction and growth of various aquatic organisms and plants. Since 2003, the proportion of eutrophic lakes and reservoirs in China has increased from 50% to an average of 77.93%, while the proportion of eutrophic reservoirs alone has nearly doubled from 15.05% to 28.8%. Among the lakes monitored by the government in 2013 and 2015, many of the eutrophic lakes are also leading areas for pearl culturing.
As a result of the Chinese government’s strict environmental regulations, the extensive feeding model with massive fertilization is no longer permitted. The government has carried out the forced demolitions of some pearl culturing areas during the past three years, and the three largest freshwater pearl-culturing provinces/regions also have implemented strict bans on cultured pearls. Meanwhile, the central and eastern provinces such as Hubei and Zhejiang began compulsory demolition of freshwater pearl culturing in 2017, which caused a dramatic decline in pearl output.
This has been a major setback for freshwater pearl farmers, aquaculture companies, and pearl workers. The Chinese government at all levels has subsidized the farmers who have suffered from demolition, though most are still reported to have suffered serious losses because of culturing bans.
At the same time, the new environmentally friendly and standardized aquaculture models will usher in a new era for Chinese freshwater cultured pearls. The Chinese Academy of Agricultural Sciences and various enterprises have developed many new culturing methods. For example, fish-clam mixed cultivation has been shown to improve water quality and increase output value, and the three-part aquaculture model of fish, clam, and poultry can balance ecological concerns and generate considerable income. Environmentally friendly aquaculture will become the new standard for freshwater cultured pearls, and it will take about 5 to 10 years to adopt automated aquaculture technology across mainland China.
To summarize, wholesale and retail prices of Chinese freshwater pearls will fluctuate significantly in the next two to five years based on the freshwater pearl culturing cycle. China’s freshwater cultured pearl industry has formed a complete and relatively mature supply chain over the past decade. It is still facing new challenges, new development opportunities, and critical decisions for a sustainable industry under the government’s new policy and the promotion of new aquaculture technologies. At the same time, the increasing demand for high-quality freshwater cultured pearls in China and around the world is prompting the upgrade and transformation of the product.
REFERENCES
Akamatsu S., Li T.Z., Moses T.M., Scarratt K. (2001) The current status of Chinese freshwater cultured pearls. G&G, Vol. 37, No. 2, pp. 96–113, http://dx.doi.org/10.5741/GEMS.37.2.96
New York Water Quality Standards (2016) https://www.epa.gov/sites/pro-duction/files/2014-12/documents/nywqs-section1.pdf
Comparison of Laser Ablation and Solution ICP-MS Analyses of Emeralds
Ruan Hattingh1, Raquel Alonso-Perez2, Aaron C. Palke3, Lee Groat4, and James M.D. Day1 (presenter)
1Scripps Institution of Oceanography, La Jolla, California
2Harvard University, Cambridge, Massachusetts
3GIA, Carlsbad, California
4University of British Columbia, Vancouver, Canada
Geochemical studies of emeralds can confirm their provenance and improve our understanding of deposit origin. LA-ICP-MS is a minimally destructive and relatively high-throughput technique that allows determination of more than 30 major, minor, and trace elements simultaneously using small spot sizes (20–100 μm). A reliable and consistent LA-ICP-MS protocol requires good standardization, including the use of matrix-matched standard reference materials. Here we provide a robust assessment of the quality of LA-ICP-MS analysis of emeralds, utilizing a set of natural and synthetic gem-quality emeralds housed within the Mineralogical & Geological Museum at Harvard University. Our goals were to identify large emeralds as potential standard reference materials and to examine the robustness of certain trace elements in emeralds for provenance and for petrogenetic models of their origin.

In this study, we have analyzed more than 45 emeralds using both LA-ICP-MS and solution ICP-MS techniques. For solution ICP-MS, between 5 and 10 mg of individual emeralds was digested in HF-HNO3 prior to analysis of Be by standard addition and all other elements by comparisons with standard reference materials spanning a range of major-, minor-, and trace-element compositions (see also the oral presentation by R. Alonso-Perez from this conference). Some emeralds that we analyzed contained small inclusions, but the majority were inclusion-free. For comparison, portions of the same emeralds were also measured by LA-ICP-MS using 100 μm spot sizes on a New Wave Research UP213 (213 nm) laser ablation (LA) system coupled to a ThermoScientific iCAPq ICP-MS. In general, we found excellent agreement for major-, minor-, and trace-element data between the solution ICP-MS and LA-ICP-MS techniques (figure 1), finding reliable results by LA-ICP-MS for Li, Be, Na, Mg, Al, Si, K, Sc, Ti, V, Cr, Fe, Ni, Zn, Ga, Rb, Cs, and Pb. Less reliable results were generated for Sr and the rare earth elements, due to the generally low abundances of these elements in emeralds. During this study, we identified natural emeralds as potential standard reference materials for future inter-laboratory LA-ICP-MS comparison, as well as a synthetic emerald (Harvard ID 109678) that is enriched in the key elements outlined above and in Mo.
Fluid Effervescence: A New Process for Natural Color Variation In Gems
Dan Marshall
Simon Fraser University, Burnaby, British Columbia, Canada
The emeralds from the Emmaville-Torrington deposit in Australia are commonly zoned (figure 1) and display alternating bands of emerald green and colorless growth zones within individual crystals at the millimeter scale. The zoning is seen optically but can be observed via imaging techniques such as backscattered electron and cathodoluminescence, and detected chemically via electron microprobe analyses. Additionally, there is a correlation between the presence of a population of primary vapor-rich fluid inclusions within the clear growth zones (figure 2) and a second population of highly saline three-phase (liquid + vapor + halite) fluid inclusions in the darker or colored growth zones.
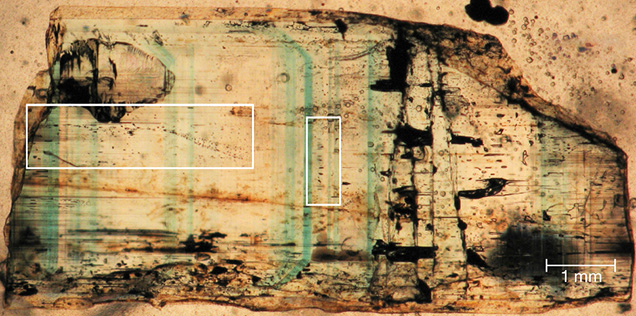

The two fluid inclusion populations appear to represent conjugate sets of a boiling or effervescent system, with the three-phase fluid inclusions having an average salinity of approximately 33 wt.% NaCl equivalent. This population undergoes total homogenization into the liquid and probably represents fluids trapped in the liquid system of a two-phase (effervescent) system. The vapor-rich population of fluid inclusions (again, see figure 2) have an average salinity of approximately 6 wt.% NaCl equivalent and homogenize into the vapor phase at higher temperatures.
The correlation of color versus clear growth zones—corresponding to high-salinity liquid-dominant and vapor-dominant low-salinity primary fluid inclusions, respectively—indicates that the color banding within the Emmaville-Torrington emerald is related to emerald precipitation in the liquid or vapor portion of an effervescing fluid system. Other emerald deposits worldwide display similar growth banding, as do some other deposits of gem topaz and gem varieties of quartz.
The Heat Treatment of Basalt-Related Blue Sapphires
Wasura Soonthorntantikul, Ungkhana Atikarnsakul, Charuwan Khowpong, and Sudarat Saeseaw
GIA, Bangkok
Heat treatment is the most common method used to improve the color and/or clarity of corundum. Basalt-related blue sapphires typically have an unattractive dark blue color due to their high iron content, and low-temperature heat treatment can be applied to lighten this material (Nassau, 1981; Hughes et al., 2017). The main factors that influence the changes in corundum are the temperatures employed, the conditions in which they are heated, and the duration of the treatment process. However, it is difficult to distinguish between naturally heated and heat-treated blue sapphires from basalt-related deposits using only standard gemological testing and microscopic examination. In this study, basalt-related blue sapphires from various locations (Thailand, Cambodia, Australia, and Nigeria) were heat treated at low temperatures, ranging from 700 to 1050°C, for durations of 1.75, 7, and 28 hours in air (oxidizing atmosphere). The changes in color appearance, UV fluorescence, internal features, and spectroscopic properties were investigated.
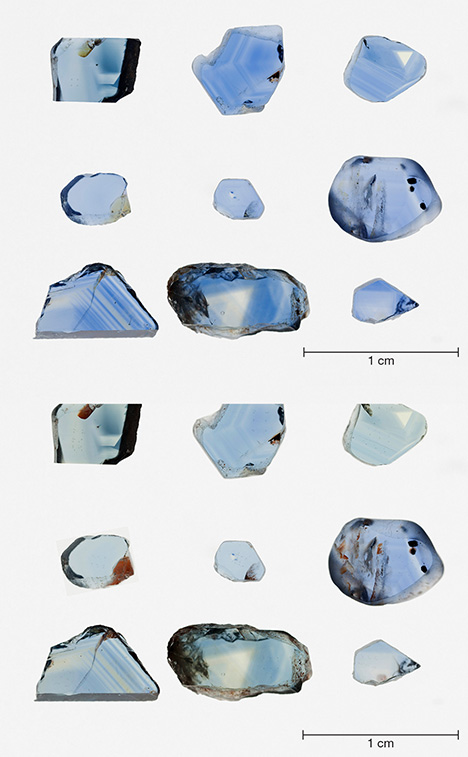
The results indicated a negligible change or a slight lightening of the blue color after treatment at 700°C, while an obvious lightening of the blue color resulted from heating at 900°C and 1050°C (figure 1). Some solid inclusions, iron stains, and partially healed fractures showed signs of alteration during the heating experiments, while needles and minute particles did not show any signs of change. Unheated samples were inert to short-wave ultraviolet (UV) radiation. After heating, most basalt-related blue sapphires remained inert under short-wave UV, but a few samples exhibited a very weak chalky green fluorescence. Fourier-transform infrared (FTIR) spectra obtained from the samples varied considerably, with differences between the peak intensities recorded before each heat treatment process and also after each unique temperature and time treatment combination. In most cases, unheated blue sapphires from basalt-related deposits revealed the characteristic 3309 cm–1 series of peaks in the FTIR spectrum (the intensity of 3232 cm–1 being much lower than that of 3309 cm–1). After heating at 700°C and 900°C, the intensity of the 3309 cm–1 peak decreased and the 3232 cm–1 peak increased, respectively. However, some samples that initially showed a relatively intense 3232 cm–1 peak in the series before treatment exhibited a more intense 3309 cm–1 peak and a less intense 3232 cm–1 peak post-treatment. After heating at 1050°C for 1.75 hours, we recorded a decrease in the intensity of the 3309 cm–1 peak and an increase in the 3232 cm–1 peak, to the point where they were of almost comparable intensity. When subsequently heated for 7 and 28 hours, the intensity of 3309 cm–1 peak increased and that of the 3232 cm–1 peak decreased (figure 2). The ultraviolet/visible/near-infrared (UV-Vis-NIR) spectra obtained from the samples heated at 900°C and 1050°C for 1.75, 7, and 28 hours showed a reduction in the height/intensity of the broad band centered at 580 nm related to an Fe2+-Ti4+ intervalence charge transfer. This reduction is the root cause of the lighter color after heat treatment.

The results of this study show that even with advanced data, it is very challenging to separate basalt-related stones that have been heated from those that have not undergone any post-mining heat treatment, owing to the variable results associated with the experimental temperatures and durations used. Inclusion studies may provide sufficient evidence in some cases, but even when comparing the inclusions scene before and after treatment, separation often remains challenging.
REFERENCES
Hughes R.W., Manorotkul W., Hughes E.B. (2017) Ruby & Sapphire: A Gemologist’s Guide. RWH Publishing/Lotus Publishing, Bangkok, pp. 146–148, 200–201.
Nassau K. (1981) Heat treating ruby and sapphire: Technical aspects. G&G, Vol. 17, No. 3, pp. 121–131, http://dx.doi.org/10.5741/GEMS.17.3.121
“Low-Temperature” Heat Treatment of Mozambican Ruby
Sudarat Saeseaw, Charuwan Khowpong, and Ungkhana Atikarnsakul
GIA, Bangkok
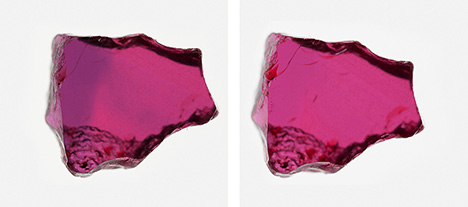
Mozambique is one of the most important sources of ruby today, with the Montepuez mine producing material ranging from light to dark purplish red. To improve their color, Montepuez rubies are heated at low temperatures to remove the purplish component—caused by blue color zoning—and create a more attractive and desirable red color. For this study, 47 samples were selected for heat treatment in air (oxidizing environment) at different temperatures and varying durations. The samples were heated to 600, 700, 800, and 900°C for 2 hours and 40 minutes, 8 hours, or 24 hours. The results showed no significant change to the blue color zoning when heated to 600 or 700°C over any of the time frames chosen; however, the blue component was reduced when heated to a minimum of 800°C for 2 hours and 40 minutes (figure 1).
Observing any changes to inclusions can be challenging when examining material subjected to lower-temperature heating, since there is less chance inclusions will be affected (Pardieu, 2015). Inclusions in Mozambican rubies are limited to needles, platelets, and other fine particles. When any alteration takes place, the evidence is very subtle. During treatment, spots can form on these platelets (figure 2), although this is not always the case. When crystalline inclusions are present, it is easier to identify heat treatment because fractures often develop around them, especially in larger crystals. Some gems contain fractures with associated iron staining or fingerprints, and their appearance may change drastically during treatment (Sripoonjan, 2016). Inclusion studies are not always conclusive, however, and advanced techniques such as FTIR spectroscopy are needed to assist in detecting low-temperature heat treatment. The presence of the 3309, 3232, and/or 3185 cm–1 peak(s) appears related to heat treatment, since they were only observed in heated stones.

REFERENCES
Pardieu V., Saeseaw S., Detroyat S., Raynaud V., Sangsawong S., Bhusrisom T., Engniwat S., Muyal J. (2015) GIA lab reports on low-temperature heat treatment of Mozambique ruby. GIA Research News, Apr. 28, https://www.gia.edu/gia-news-research-low-temperature-heat-treatment-mozambique-ruby
Sripoonjan T., Wanthanachaisaeng B., Leelawatanasuk T. (2016) Phase transformation of epigenetic iron staining: indication of low-temperature heat treatment in Mozambique ruby. Journal of Gemmology, Vol. 35, No. 2, pp. 156–161.
Pearl Classification: GIA’s Approach
Joyce Wing Yan Ho and Sally Chan Shih
GIA, New York
Pearls form in a wide variety of sizes, shapes, and colors. As a result, they are among the most popular materials in the jewelry industry. Their unique appearance and the affordability of many types of cultured pearls on the market have allowed them to gain a greater audience. Throughout the ages, pearls have been associated with class, grace, and beauty by many cultures. Such a diverse range of pearl types has meant that a way of grading or classifying them was required, and as a consequence, a number of different grading systems have been developed. The differences make the comparison of grades between systems difficult to align, and agreeing on a universal grading system has remained one of the many challenges facing the pearl industry.
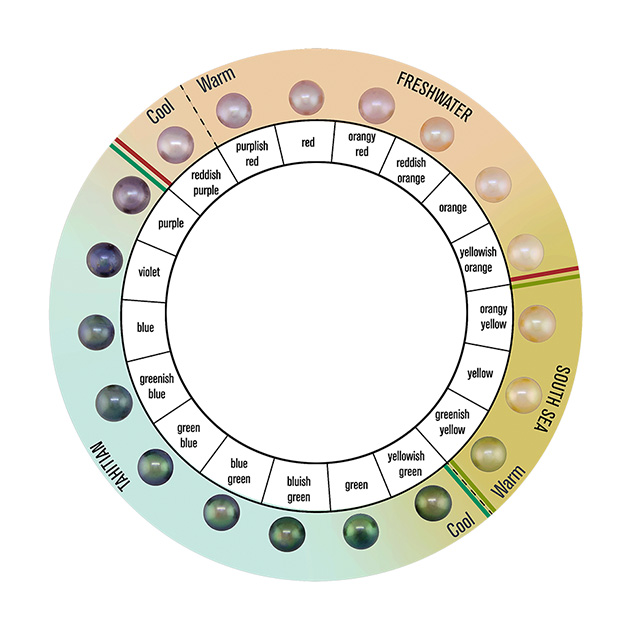
GIA created the “7 Pearl Value Factors” (figure 1) for the same reason it developed the 4Cs of diamond quality: to establish a standard terminology for describing quality using language everyone can understand. Each value factor is important in determining a pearl’s overall quality. This poster reviews each value factor, starting with size and then looking at shape, color, luster, surface, nacre quality, and matching. GIA has developed a modernized color scale for all types of pearls (saltwater and freshwater) and physical master sets to ensure a pearl is graded with a degree of consistency. Every GIA laboratory worldwide uses the same grading system to produce consistent results. Adopting GIA’s standard pearl classification terminology throughout the gem and jewelry industry would foster improved communication within the trade and, by default, bridge the communication gap between buyers and sellers through easily understandable terminology.
A Pearl Identification Challenge
Nicholas Sturman1, Laura M. Otter2,4, Artitaya Homkrajae3, Areeya Manustrong1, Nanthaporn Nilpetploy1, Kwanreun Lawanwong1, Promlikit Kessrapong1, Klaus Peter Jochum4, Brigitte Stoll4, Herman Götz5, and Dorrit E. Jacob2
1GIA, Bangkok
2Macquarie University Department of Earth and Planetary Sciences, Sydney
3GIA, Carlsbad, California
4Max Planck Institute for Chemistry, Mainz, Germany
5Johannes Gutenberg University, Mainz, Germany
Pearl testing in laboratory conditions usually follows a set routine. The pearls are examined to obtain a preliminary idea of their type and identification, and then a series of steps (e.g., trace-element geochemical analysis, optical X-ray luminescence, microradiography, and X-ray computed microtomography) are undertaken to confirm the initial examination. With experienced gemologists it is possible, in many cases, to reach the same conclusion that was arrived at after the initial examination. However, all experienced gemologists have encountered situations—whether handling pearls or other gems—where the final result does not match the initial opinion.
This poster illustrates the trace-element characteristics of pearls in general, but focuses on two nacreous pearl samples in particular that revealed “atypical” properties not encountered in any pearls tested previously by GIA gemologists. On initial examination, the pearls did not show clear indications of being either freshwater or saltwater. Nor was it clear whether they were likely to be natural or cultured. In most cases, these two questions would be resolved very quickly after some of the initial examination procedures were completed. This was not the case with these two examples, however, since the energy-dispersive X-ray fluorescence (EDXRF) results conflicted with the optical X-ray luminescence observations. This led to additional LA-ICP-MS analysis, a procedure not often required in routine pearl testing. The situation appeared even more perplexing after RTX work revealed inconclusive structures, which led to additional analysis using μ-CT. The pearls were so unusual in a number of ways, especially with regard to their trace-element chemistry, that we decided to seek a second opinion on this aspect in particular. Hence, the pearls were sent to the Max Planck Institute for Chemistry (MPIC) in Mainz, Germany.
The results of the work by GIA and MPIC showed that the pearls consisted of layer-like zones with distinct trace-element signatures associated with both saltwater and freshwater environments, as confirmed by the spot analysis undertaken by three different LA-ICP-MS units in three different locations operated by three different groups of scientists. While the pearls were in Germany, the opportunity was also taken to perform μ-CT analysis on both samples. The results were in keeping with those obtained by GIA, though the interpretation of the structures was not straightforward and together with the trace-element chemistry led to various questions about the producing mollusk and the origin/type.
In summary, the pearls were found to be a mixture of saltwater and freshwater layers. While the pearls are likely non-bead cultured, their true identity remains a puzzle owing to their complex chemistry and questions raised concerning the producing mollusks. To our knowledge, these pearls with mixed trace-element patterns are the first of their type recorded in the literature.
The Study of Tanzanite’s Gemological and Color Characteristics
Jinding Yu and Ren Lu
Gemmological Institute, China University of Geosciences, Wuhan
Tanzanite was discovered in the Merelani Hills in the Arusha region of northeastern Tanzania during the 1960s. It first became popular with a promotional campaign by Tiffany & Co. in the late 1960s. The fact that there is only one deposit in the world further raised its value. Never before had a newly discovered gemstone gained so much success within such a short time.
Natural, unheated blue tanzanite is rare and known for its trichroic colors: bluish violet, violetish blue, and yellow-green. To best realize the hidden beauty, natural tanzanite, often showing a brown hue, is heated to achieve a predominantly blue coloration before reaching the market. It has been previously reported that heated tanzanite will convert from trichroic to dichroic, but there have been few details and virtually no quantitative UV-Vis absorption coefficient data to support that claim.
Tanzanite exhibits metachromatism, a color change, when illuminated by cold and warm light sources. In addition, tanzanite also exhibits the Usambara effect. The only form of zoisite to have its Usambara effect studied until now was epidote. If these two color phenomena are also recognized, it will raise tanzanite’s status and value.
For this study we chose several brown zoisites, a violet tanzanite, a pink zoisite and a green zoisite from Merelani, and a green zoisite from Afghanistan. We conducted a systematic and quantitative analysis of the tanzanite sample using XRF and LA-ICP-MS, as well as FTIR, Raman, and UV-Vis spectroscopy. We attempted to quantitatively analyze the tanzanite’s color before and after heating.
The results showed that tanzanite changed from trichroic to nearly—but not completely—dichroic after heating. The difference between these two types of blue was eye visible but also indicated by the spectrum and the photos. The study revealed tanzanite’s color-change quantitative data and the method for taking photos of its color-change effect. We also found that the brown zoisite displayed the Usambara effect. Lastly, we concluded that the tanzanite’s blue level is probably related to vanadium.

REFERENCES
Liu Y., Shigley J.E., Halvorsen A. (1999) Colour hue change of a gem tourmaline from the Umba Valley, Tanzania. Journal of Gemmology, Vol. 26, No. 6, pp. 386–396.
Schmetzer K., Bernhardt H.-J., Bosshart G., Hainschwang T. (2009) Colour-change garnets from Madagascar: Variation of chemical, spectroscopic and colorimetric properties. Journal of Gemmology, Vol. 31, No. 5-8, pp. 235–282.
Sun Z., Palke A.C., Renfro N. (2015) Vanadium- and chromium-bearing pink pyrope garnet: Characterization and quantitative colorimetric analysis. G&G, Vol. 51, No. 4, pp. 348–369, http://dx.doi.org/10.5741/GEMS.51.4.348
.jpg)


