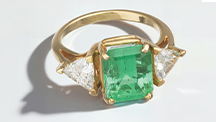
A Comparison of Modern and Fossil Ivories Using Multiple Techniques
ABSTRACT
To distinguish between modern and fossil (mammoth) elephant ivory, samples of both were analyzed by petrographic microscopy, scanning electron microscopy, infrared spectroscopy, and laser-induced breakdown spectroscopy. In addition to the differences observed under low magnification, SEM demonstrated each variety’s structure in greater detail. While modern ivory appeared very compact under high magnification, fossil ivory showed a loose structure with many long channels and splintery cracks. IR spectroscopy revealed differences in water and collagen contents. Modern ivory exhibits a broad IR absorption band around the 3320 cm–1 peak, while the sharp bands between 3300 and 3500 cm–1 in fossil ivory indicate a much lower water content. Modern ivory’s IR peaks at 2927 and 2855 cm–1, compared to fossil ivory’s weak peak near 3000 cm–1, suggest a significant loss of collagen after burial for tens of thousands of years. LIBS chemical analysis showed different amounts of various trace elements. Weakly weathered fossil ivory contains Fe, Ti, Mn, and Al, while the similar-looking modern ivory contains Hg, Cr, and Si, indicating that trace elements could be used to distinguish them.
INTRODUCTION
The modern elephant, threatened by extinction, is protected by international agreements banning the sale of ivory from tusks. This trade ban does not apply to ornaments made of mammoth fossil ivory, which is still legally sold in the gem market. The two materials look similar, and it is difficult to distinguish them with the unaided eye, especially when the fossil ivory is relatively unweathered. There is such a need to identify the modern and mammoth ivory in the Chinese jewelry market because the jewelry prices of modern ivory and fossil ivory vary greatly. For example, the price of modern ivory bangles range from US$400–$500 per piece, while the price of mammoth fossil ivory bangles ranges from US$200–$300 per piece.
Mammoth is an extinct mammal species belonging to the Elephantidae family, which lived during the late Pleistocene in Europe, northern Asia, and North America. Their fossils are commonly found in frozen ground in Alaska and Siberia. Reports on mammoth have mainly dealt with the species’ life, extinction, and prospects for regeneration (Iacumin et al., 2005; Basilyan et al., 2011). Gemological studies on mammoth ivory are virtually nonexistent, while the literature on elephant ivory is also quite limited (Edwards and Farwell, 1995; Edwards et al., 1997; Raubenheimer et al., 1998; Su and Cui, 1999; Reiche et al., 2001; Sakae et al., 2005; Edwards et al., 2006; Singh et al., 2006; Müller and Reiche, 2011). This study examines the two ivories’ structure and chemical composition to better explore their identification characteristics.
MATERIALS AND METHODS
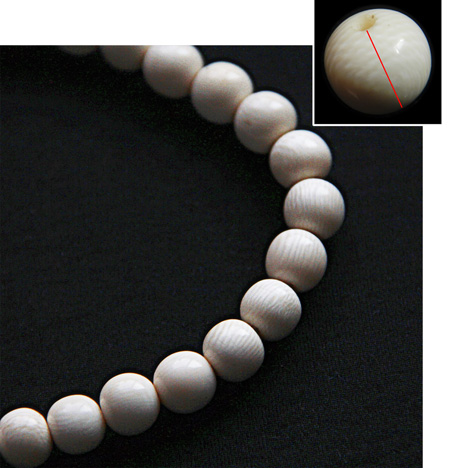
The modern elephant ivory samples consist of beads provided by the Museum of China University of Geosciences (figure 1). They are originally from Thailand and belong to the Asian elephant species. The authors were allowed to cut one bead in half for scanning electron microscopy (SEM) testing.
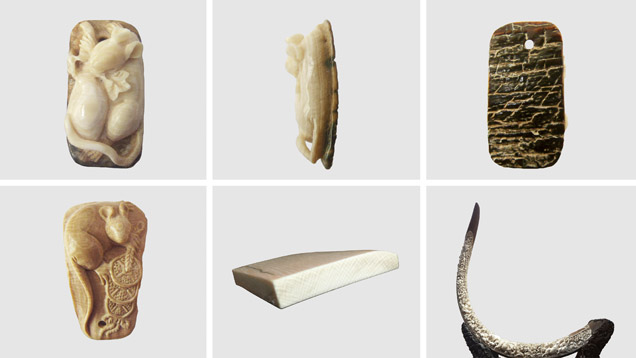
The authors obtained fossil ivory specimens from mammoth tusks sold in the gift shop at the Geological Museum of Guangdong Province, China. All three samples (figure 2) were cut perpendicular to the length of the tusk. Sample M1 contained three layers: a strongly weathered black surface, a semi-weathered brown middle layer, and a weakly weathered white inner layer. This sample was sliced into four pieces for analysis, and each piece contained all three layers. Sample M2 contained only the semi-weathered brown middle layer, and M3 only the weakly weathered white inner layer.
The samples underwent standard gemological testing to determine their spot refractive index, specific gravity, and UV fluorescence reaction. To study the structure at various resolutions, the samples were observed using both a petrographic microscope and SEM. Samples or sample portions from both ivory types were carefully ground with carborundum until they became nearly transparent thin sections for examination with the petrographic microscope. A Quanta 200 scanning electron microscope at the China University of Geosciences in Wuhan was used for this study. Samples with Schreger lines were chosen, and they were cleaned with alcohol and dried in air. The specimens were fractured by the authors, and the fracture surfaces were sputter-coated with gold powders using a SCD-005 ion sputtering coater. Then they were fastened to a round metal board for observation. The resolution of the Quanta 200 is 3.5 nm under 30 KV voltage in both high- and low-vacuum modes, 3.5 nm in ESEM vacuum mode under 30 KV, and 15 nm in a low vacuum under 3 KV. We used 7×–1,000,000× magnification and an accelerating voltage of 200 V to 30 KV with a tungsten filament and a maximum beam current of 2 μA. The SEM images are from secondary electrons.
Infrared spectral analysis was carried out using a Nicolet 550 Fourier transform infrared (FTIR) spectrometer with a resolution of 0.5 cm–1, a scanning range of 4000–400 cm–1, and 32 scans per second at room temperature (25ºC). Half of a modern ivory bead and one fossil specimen with black, brown, and white layers (sample M1) were analyzed in transmission mode with a KBr pellet. Only the white layers of sample M1 were tested by FTIR, because their color was close to that of modern ivory.
Laser-induced breakdown spectroscopy (LIBS) analysis was carried out using a LIBS2005 with Nd:YAG solid state laser (1064 nm wavelength) at the China University of Geosciences to measure trace elements semi-quantitatively. (See box A for more on this technique.) The test used a voltage of 500–650V and a frequency of 10 Hz.
Box A: What Is LIBS? |
|
Laser-induced breakdown spectroscopy is a rapid chemical analysis technique. A modern LIBS system includes a laser source, delivery optics, collecting optics, a spectrometer, and an attached computer (figure A-1). This technology requires no sample preparation. Broad elemental coverage and extremely short measurement time for each spot are additional advantages that make this one of the most practical and efficient micro-beam technologies available to gemologists. 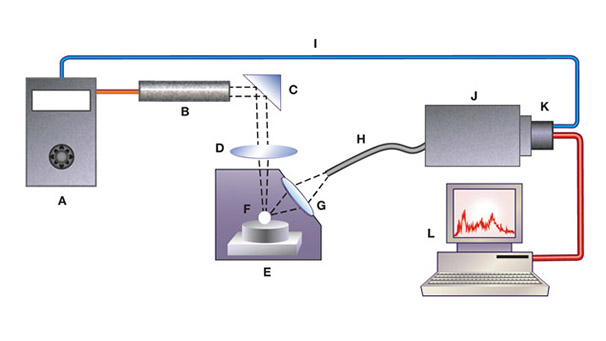
Figure A-1. This diagram shows the main components of a modern LIBS system: (a) laser source and cooler; (b) pulsed laser head; (c) mirror; (d) focusing lens; (e) excitation chamber; (f) sample; (g) collecting optics; (h) optical fiber; (i) detector trigger signal; (j) wavelength selector; (k) detector array; and (l) microcomputer. From Pasquini et al. (2007).
|
RESULTS AND DISCUSSION
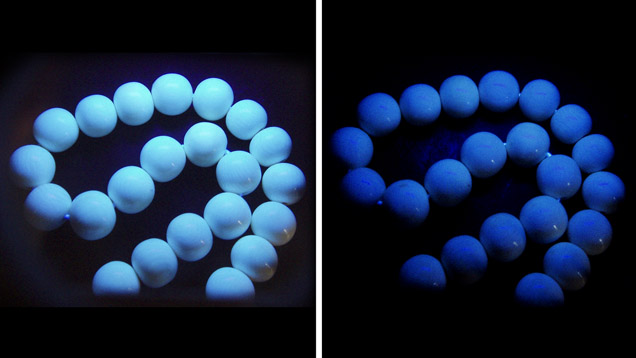
Gemological Properties. Both ivory types showed overlapping spot RI (1.52–1.54) and SG (1.69–1.81), so they cannot be distinguished by these properties. The modern ivory beads fluoresced bluish white to long-wave UV radiation and very weak bluish white to short-wave UV (figure 3).
The weakly weathered white layer of fossil ivory (M1) showed stronger fluorescence to long-wave than short-wave UV, while the semi-weathered brown layer (M2) displayed weaker fluorescence than the white layer under both long- and short-wave UV (figure 4, top). The strongly weathered black layer from sample M1 was inert to both wavelengths. These observations suggest that the degree of weathering is inversely proportional to the strength of fluorescence reaction.
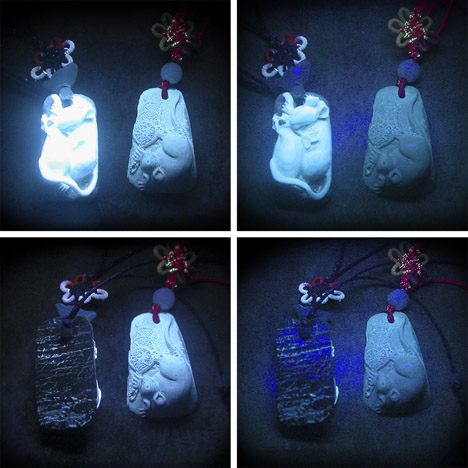
Both ivories are composed mainly of the mineral hydroxyapatite and organic materials. Because hydroxyapatite usually does not display characteristic fluorescence while the organic material typically does, ivory with more organic material displays a more intense fluorescence. This implies that weathering is more destructive for organic than inorganic material.
Structural Analysis. Both modern and mammoth elephant ivories display intersecting chevron patterns known as Schreger lines (Singh et al., 2006; Palombo et al., 2012). The Schreger angle of the modern elephant ivory sample is about 115° or 65° (see figure 1, inset). According to Singh et al. (2006), the mean Schreger angle value taken at all three portions in Asian elephant ivories is (91.1 ± 0.70)°.
Fossil ivory sample M3 (again, see figure 2) has a Schreger angle of approximately 100º. According to Fisher et al. (1998), the Schreger angles in mammoth tusks range from 62º to 105º within the various layers, with a mean of 87.1º. The Schreger angles from the outermost layer of mammoth tusks, measured by Trapani and Fisher (2003) at the dentine-cementum junction, range from about 70º to 100º (Palombo et al., 2012). Therefore, identification of fossil and modern ivories based on Schreger angles requires caution. Ivory ornaments cut from different layers of the tusk, or cut at a slightly different angle relative to the length of the tusk, can have varying Schreger angles.
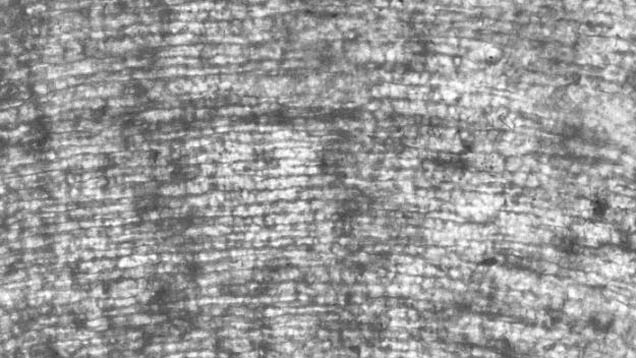
Microstructure. Modern Elephant Ivory. A photomicrograph of modern ivory at 200× magnification shows that the Schreger pattern lines (the sparse vertical lines) occur along one direction (figure 5). The thin horizontal lines closely parallel to each other are polishing lines.
Fossil Ivory. The thin section is made of semi-weathered sample M2. At 200× magnification, the Schreger lines are not apparent; only polishing lines and cracks can be observed (figure 6).The thin section fashioned from only the white layer of sample M1 showed no obvious differences with modern ivory under the petrographic microscope, because the white layers are less weathered and both look similar at less than 500× magnification.
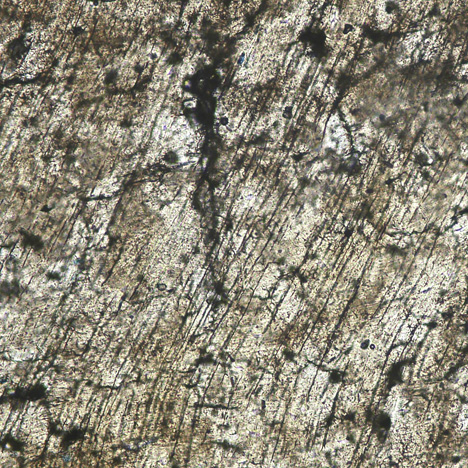
Schreger lines of both ivory types are visible at lower magnification (less than 100×) through the thin section. At higher magnification, the Schreger lines are less likely to be seen. Cracks and holes cannot be observed in a modern ivory thin section, but they are obvious in fossil ivory sample M2.
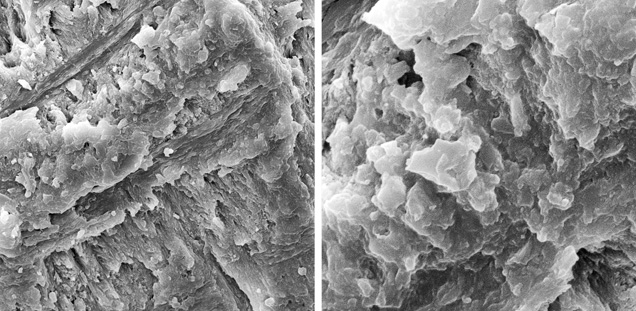
SEM Analysis. Modern Ivory. SEM images obtained from the bead in figure 1 at various magnifications show some interesting features. First, the structure of modern ivory appears compact and has a laminar structure generally composed of platy layers parallel to each other, forming a step-like pattern (figure 7, left and center). Another notable feature is that the layers forming the ivory body also display a platy structure at high magnification (figure 7, right).

Fossil Ivory. The intensely weathered black layer of fossil ivory sample M1 showed the following characteristics.
Broken and crushed splintery cracks were often observed on the rupture surface (figure 8). Although there were cracks in both kinds of ivory (figure 7, left; figure 8, left), their formation was different. Because modern ivories contain a high proportion of organic materials, external mechanical forces usually cause cracks to occur straight through the surface. But because the organic materials in fossil ivories reduce gradually due to weathering, the cracks tend to form gradually into splinters. Under long-term weathering (figure 8), the structure of the fossil ivory is probably loosened by the lack of organic materials, which reduces the binding force to arrange hydroxyapatite (Qi et al., 2010).
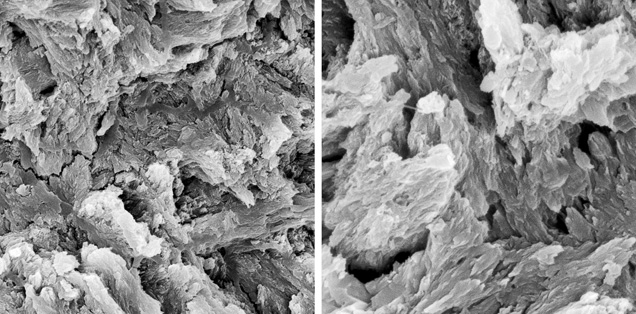
Many long, narrow channels and small holes were found in the intensely weathered layer of fossil ivory M1. These cylindrical channels were common in SEM images of mammoth ivory samples from this study. They oriented themselves along the length of the ivory. Previous studies (Su et al., 1999; Ge et al., 2006) concluded that in prehistoric bones and ivories, hydroxyapatite exists on the nanoscale (10–9 m) with a laminar structure and its c-axis oriented along the length of collagen fibers. Müller et al. (2011) pointed out that in all ivories the collagen fiber bundles are organized around the pulp cavity in the center of the tusk. The black surface layers experienced the most rapid loss of organic substance. Based on the orientation and shape of these channels and holes, we deduce that they were caused by the loss of collagen fibers.
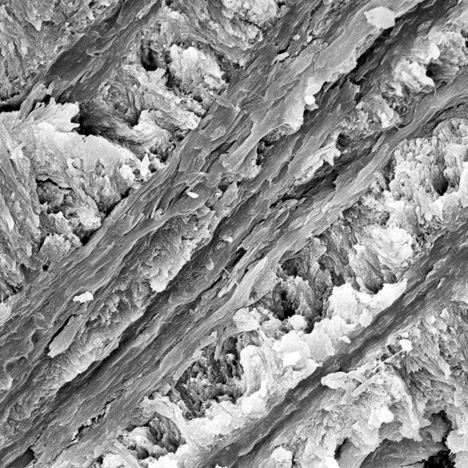
Some obvious and irregular grooves lie perpendicular to the crystal stacking layers in the black layer of fossil ivory. The grooves can be individual or overlapping (figure 10). They are different from the channels in figure 9, with a nearly vitreous luster. Existing research and observation with the polarizing microscope suggests that the grooves are related to collagen fibers and the growth mechanism of the Schreger lines (Su et al., 1999).

Magnification at 1500–6000× shows that the structure of the weakly weathered white layer of fossil ivory M1 is nearly as compact as the structure of modern ivory (figure 11). There are some tiny holes in the white layer, but they are less abundant and less obvious than those of the black layer (figure 9, left). Similarly, we deduce that the holes were likely formed due to the loss of organic materials by weathering.
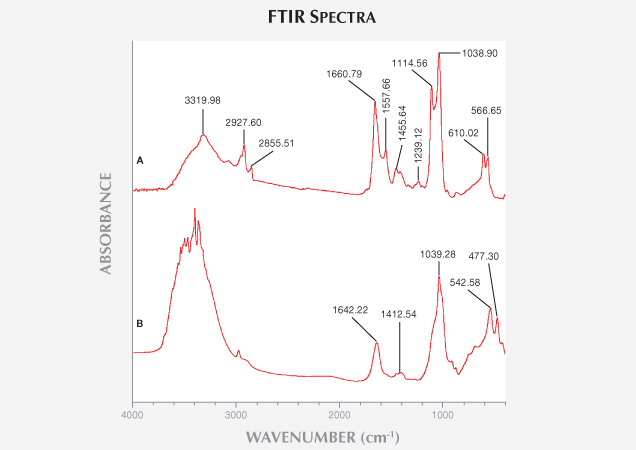
Chemical Analysis. Infrared Spectroscopy. Dan et al. (2006) showed that ivory is composed of biogenic hydroxyapatites and collagen. Living creatures’ hydroxyapatites are slightly crystallized. Upon burial, non-crystalline hydroxyapatite will start to crystallize due to diagenesis. Comparison of modern and the least weathered fossil ivories’ FTIR spectra (figure 12) showed the following results:
1. 4000–3000 cm–1: Modern ivory has a broad IR absorption band around the 3320 cm–1. In the least weathered layer of fossil ivory, some sharp bands are found between 3300 and 3500 cm–1. Dan et al. (2006) demonstrated that the IR absorption bands between 3400 and 3500 cm–1 are caused by hydroxyl stretching vibration, which indicates that fossil ivory has a much lower water content than modern ivory.
2. 3000–2000 cm–1: The IR absorption peaks of modern ivory at 2927 and 2855 cm–1 result from collagen (Qi et al., 2005). Because the samples were handled with gloves and wiped with alcohol and dried in the air, contamination can be ruled out. Modern ivory’s absorption peak at 2927.60 cm–1 is caused by asymmetric stretching vibration of the CO32- group, and the 2855.51 cm–1 peak is caused by symmetric stretching vibration of CO32- groups (Farmo, 1982). The IR absorption spectra of fossil ivory have a weak absorption peak near 3000 cm–1, indicating a significant loss of collagen after burial for tens of thousands of years (Qi et al., 2005).
3. 2000–1000 cm–1: The IR spectra of modern elephant ivory feature two strong absorption peaks at 1660.79 and 1557.66 cm–1, caused by bending vibration of coordinated water, or twisting of H-O-H. Fossil ivory spectra show only a weak absorption peak at 1642.22 cm–1, indicating much lower water content (Zhou et al., 1999). Both kinds of ivory have a strong absorption band at 1038.90 cm–1, caused by asymmetric stretching vibration of the PO43- group, because their major constituent is hydroxyapatite. The biogenic hydroxyapatites have three absorption peaks at 1541–1548, 1455, and 1417 cm–1 (Huang et al., 2007).
4. 1000–400 cm–1: Both kinds of ivory have two peaks and exhibit no obvious differences here.
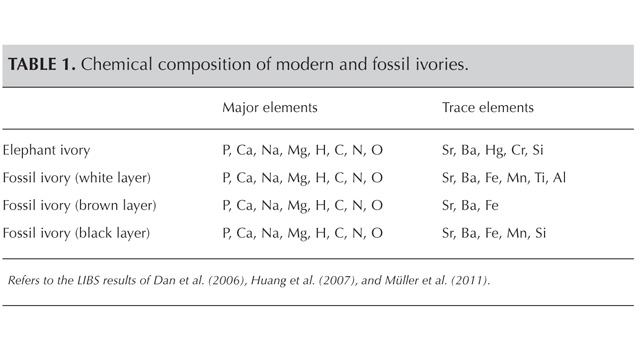
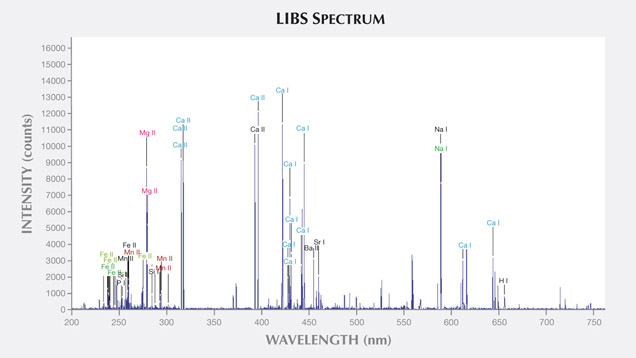
LIBS Analysis. Ivory is composed of 70% hydroxyapatite (some of the calcium having been replaced by magnesium) and 30% organic substance (collagen fibers). Thus the major elements of both ivories are the same: Ca, Na, Mg, P, H, C, N, and O, with higher concentrations of Ca, Na, and Mg (figures 13–16) (Müller et al., 2011; Huang et al., 2007; Dan et al., 2006).
Comparing the LIBS data of modern ivory and the three layers of fossil ivory (table 1), we found that:
1. Besides the major elements consistent in both kinds of ivory, modern ivory has Hg, Cr, and Si; the white layer of fossil ivory contains Fe, Ti, Mn, and Al.
2. The Al and Ti in the white layer of fossil ivory are absent in the brown and black layers.
3. The black surface layer of fossil ivory contains some Si, which is absent in the white and brown layers.
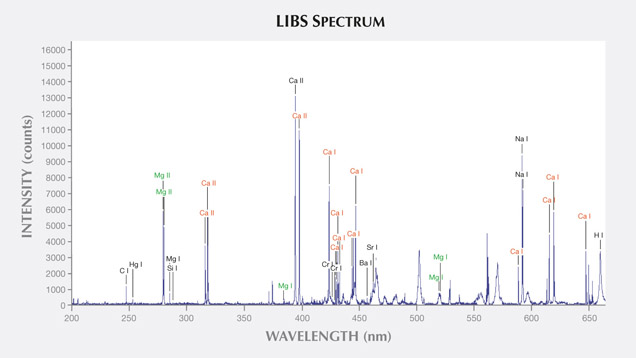
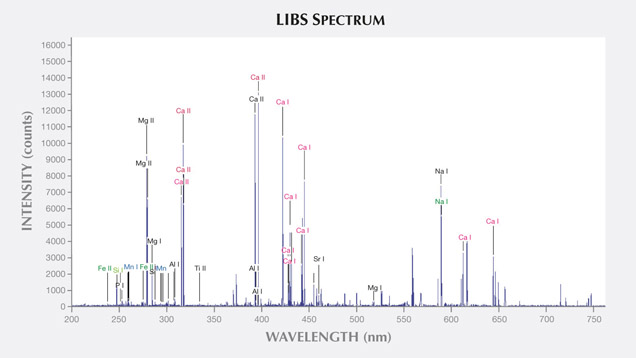
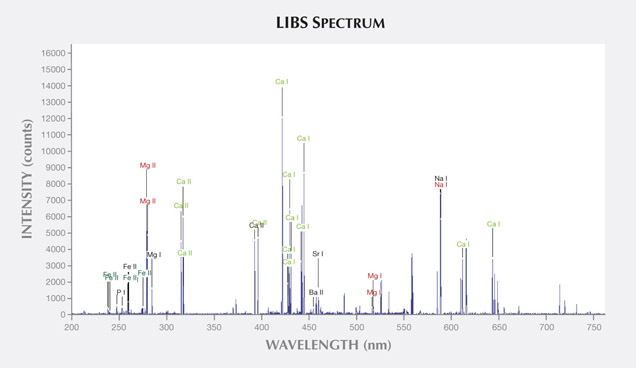
As noted by Wilson and Pollard (2002), chemical changes achieve thermodynamic equilibrium between the archaeological material and the surrounding environment. According to this principle, all bone materials should tend to have an identical chemical composition under similar environmental conditions. We inferred that Sr and Ba are common replacements for Ca in the apatite of both ivory types. Due to the different living environments of mammoth and modern elephants, Fe, Mn, Ti, and Al replaced Ca in mammoth ivory; Hg, Cr, and Si replaced Ca in modern elephant ivory.
Singh et al. (2006) found higher concentrations of P, Mg, and Cr in Asian elephant ivory than in the African species. Thus it is possible to distinguish fossil and modern ivories by analyzing their trace element concentrations. Although our current research did reveal some differences between the two types of ivory, many more samples are needed for a conclusive discrimination.
CONCLUSION
This comparison of fossil and modern ivories suggests multiple ways to distinguish them. Schreger angles are often used to identify different types of ivories, but these are not definitive. The observed Schreger angle can vary depending on the layer of a tusk and the cutting angle relative to the length of the tusk. Microscopic examination of fossil ivory samples revealed broken lines, cracks, long channels, and grooves that were not seen in the modern ivory samples. The infrared spectrum of modern elephant ivory showed distinct absorption peaks related to collagen, while fossil ivory did not show these peaks. Similarly, absorption peaks related to coordinated water are pronounced in modern elephant ivory’s spectrum and weak in that of mammoth ivory. FTIR testing proved effective in identifying the two kinds of ivories. LIBS analysis showed that besides the major elements consistent to both kinds of ivory, white fossil ivory contains Fe, Ti, Mn, and Al, while modern ivory has Hg, Cr, and Si. The difference in trace element concentrations can potentially assist in the identification of fossil and modern ivories.
