
ABSTRACT
Until now, the observation of three-phase inclusions in emeralds has been considered a potential indicator of Colombian origin. Nevertheless, emeralds from Afghanistan (Panjshir Valley), China (Davdar), and Zambia (Kafubu and a new deposit at Musakashi) may contain three-phase inclusions resembling those often found in specimens from Colombian deposits (Muzo, Chivor, La Pita, Coscuez, and Peñas Blancas). This article presents detailed photomicrographs of samples from these localities, with a focus on their multiphase inclusions. Also investigated are spectroscopic features and trace-element data. For the gemologist studying the origin of emeralds hosting three-phase inclusions, a powerful set of tools to aid in this determination comes from the combination of detailed microscopic examination, UV-Vis-NIR and FTIR spectroscopy, and LA-ICP-MS trace-element analysis.
INTRODUCTION
The traditional practice of assigning Colombian origin to emeralds exhibiting three-phase inclusions (Giuliani et al., 1993) is in need of updating, as we now know that such inclusions are often seen in emeralds from other locations, including China, Zambia (Schwarz and Pardieu, 2009), and Afghanistan (Hammarstrom, 1989; Bowersox et al., 1991). The characterization of these inclusions using spectroscopy and chemical composition has not been documented until now.
A new Zambian deposit at Musakashi was first reported in 2005 (Zwaan et al., 2005), and field trip reports were subsequently published (Klemm, 2009 and 2010). These articles presented historical and geological information about the mine (see box A), examined the gemological properties of these new emeralds, and presented chemical analysis using electron microprobe (Zwaan et al., 2005).
The present study characterizes emeralds containing multiphase inclusions from all of the localities above by using microscopy, spectroscopy, and trace-element analysis to create a framework for geographic origin determination.
MATERIALS AND METHODS
A total of 84 emeralds were studied, gathered from the GIA Field Gemology Collection and from gem merchants of Zambian and Colombian emeralds. Color ranged from light to deep green. The samples were studied in three forms: 55 were rough samples with one or two polished surface windows, 28 were fabricated as optical wafers oriented either perpendicular or parallel to the crystal’s c-axis, and one was faceted. After fabrication, the samples ranged from 0.18 to 4.85 ct. The group consisted of:
- Eleven samples reportedly from Musakashi (figure 1), acquired from gem dealer Guy Clutterbuck, who visited the mines several times. Weight range: 0.57–4.85 ct.
- Ten samples collected from the Kagem mine in the Kafubu area of Zambia by author VP in the summer of 2013. Weight range: 0.29–2.22 ct.
- Fifteen samples collected from Afghanistan’s Panjshir Valley by author VP in 2011. Weight range: 0.18–1.80 ct.
- Thirteen samples collected from Davdar, China, by author VP in 2005 and 2009. Weight range: 0.16–1.77 ct.
- Thirty-five Colombian samples from Muzo (12), Coscuez (12), La Pita (3), Peñas Blancas (2), and Chivor (6), acquired from Flavie Isatelle, a field gemologist/geologist who visited in May 2010, and gem merchant Ron Ringsrud. Weight range: 0.12–4.14 ct.
Standard gemological properties were measured with a Rayner refractometer (yttrium-aluminum-garnet prism) equipped with a near sodium–equivalent light source to measure refractive index and birefringence, a Chelsea filter, and four-watt long-wave (365 nm) and short-wave (254 nm) UV lamps to observe fluorescence. Due to fracturing in the samples, coupled with their relatively small sizes, no useful specific gravity measurement was acquired. The wafers’ optical path lengths were measured using a Mitutoyo Series 395 spherical micrometer with an accuracy of 2 microns. Microscopic examination was performed with GIA binocular microscopes at 10×–70× magnification, using both darkfield and brightfield illumination. Other lighting techniques, including fiber-optic illumination, were employed to investigate internal characteristics. Photomicrographs were captured at up to 180× magnification with a Nikon SMZ 1500 system using darkfield, brightfield, and oblique illumination with a fiber-optic light.
Ultraviolet through visible and near-infrared (UV-Vis-NIR) spectra were collected with a Hitachi U-2900 spectrophotometer (for polarized ordinary ray spectra) at 1 nm resolution and a PerkinElmer Lambda 950 spectrophotometer at 0.3 nm resolution, operating with a 60 mm integrating sphere accessory and a Lambda polarizer accessory. Fourier-transform infrared (FTIR) spectroscopy was performed using a Thermo Nicolet 6700 FTIR spectrometer operating with a 4× beam condenser accessory at 4 cm–1 resolution. A Renishaw inVia Raman microscope fitted with a 514 nm argon ion laser was used for identifying inclusions.
Box A: Emeralds from Musakashi, Zambia The most interesting characteristic was the presence in all the stones of three-phase inclusions, consisting of a bubble and a cube-shaped crystal in a liquid, almost identical to those commonly seen in Colombian emeralds. Zwaan et al. also identified sphene, iron oxides, feldspar, and quartz as mineral inclusions. Production reportedly resumed in 2006, starting with hand tools and progressing to the use of an excavator for a few months in 2009 (Klemm, 2009 and 2010). These reports, published after visits to Musakashi in July 2009 and August 2010, provide details adding to the history of emerald mining there. Location and Access Production and Distribution 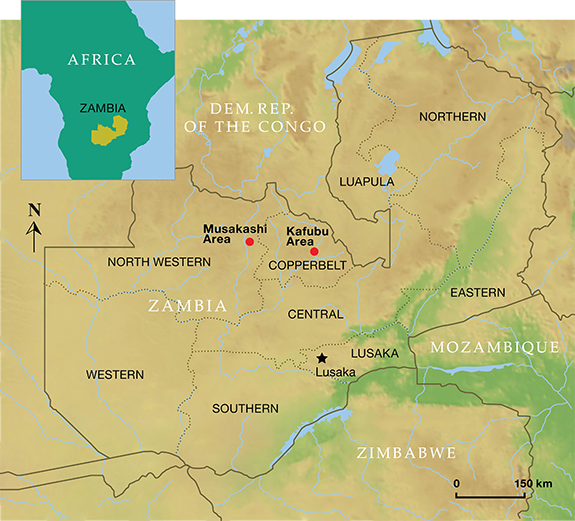 Figure A-1. This map shows the location of the Kafubu and the Musakashi emerald deposits. |
For laser ablation–inductively coupled plasma–mass spectrometry (LA-ICP-MS) chemical analysis, we used a Thermo Scientific X Series II ICP-MS combined with a Nd:YAG-based laser ablation device operating at a wavelength of 213 nm. For the ICP-MS operations, the forward power was set at 1300 W and the typical nebulizer gas flow was approximately 0.90 L/min. The carrier gas used in the laser ablation unit was He, set at approximately 0.78 L/min. The alignment and tuning sequences were set to maximize Be counts and keep the ThO/Th ratio below 2%. Laser ablation conditions consisted of a 40 µm diameter laser spot size, a fluence of 10 ± 1 J/cm2, and a 7 Hz repetition rate. For quantitative analysis, samples must be calibrated against an external standard of known composition, which meant measuring the signals for the elements of interest in the sample and comparing them to the signals for a standard with known concentrations of those elements. Generally, NIST 610 and 612 glasses were used for calibration standards. All elemental concentrations were calculated by applying 29Si as an internal standard, with Si concentration calculated from the theoretical value of beryl (31.35 wt.%). Laser spots were applied in the same area where UV-Vis spectra were collected, which was usually clean and had an even color distribution, though color-zoned areas were also sampled (figure 2).

RESULTS
Gemological Properties. The samples’ gemological properties are summarized in table 1. The refractive indices varied from 1.570 to 1.588 for nε and 1.576 to 1.593 for nω, with birefringence between 0.006 and 0.010. Emeralds from Musakashi, Davdar, and all the Colombian deposits had lower RI than the samples from Kafubu and Panjshir. The Musakashi emeralds displayed a particularly strong pink reaction in the Chelsea color filter, while a pink to strong pink display was typical in samples from all other localities except for Kafubu, in which there was no reaction.
| TABLE 1. Gemological properties of emeralds from various sources. | |||||
|---|---|---|---|---|---|
| Property | Musakashi, Zambia | Kafubu, Zambia | All Colombia | Davdar, China | Panjshir, Afghanistan |
| Refractive indices | |||||
| nε | 1.572–1.578 | 1.582–1.588 | 1.570–1.573 | 1.577–1.580 | 1.572–1.580 |
| nω | 1.580–1.582 | 1.590–1.593 | 1.576–1.580 | 1.583–1.588 | 1.580–1.590 |
| Birefringence | 0.006–0.008 | 0.005–0.008 | 0.006–0.008 | 0.005–0.008 | 0.007–0.010 |
| Chelsea filter | Strong pink | Inert | Pink to strong pink | Pink | Inert to pink |
Microscopic Characteristics.Musakashi, Zambia. In the 11 samples reportedly from Musakashi, the most common inclusions were three-phase, usually containing at least two colorless transparent crystals and a rather small gas bubble suspended in a fluid (figures 3 and 4). Such inclusions were found in every sample we studied. The gas bubble always measured within the size range of the two crystals in the multiphase inclusion. In those inclusions containing two crystals, both crystals appeared to be singly refractive under cross-polarized illumination. The larger crystal was essentially cubic and bright, while the smaller one was rounded and faint (figure 3, A and B). In many samples, the multiphase inclusions also hosted one or more small dark to black crystals, and occasionally tiny colorless or whitish crystals (figures 3 and 4).

, the CO2 gas bubble (purple), the square halide crystal (orange), and the smaller carbonate crystal (red). Photomicrograph by S. Saeseaw; brightfield illumination.")
Some of these inclusions were identified by Raman spectroscopy (figure 4); the gas phase was identified as CO2 (peaks at 1284 and 1387 cm–1). The singly refractive cubic crystals displayed only the emerald spectrum and no Raman lines, suggesting they could be halides (Venkateswaran, 1935). Daughter crystals were identified as calcite (peaks at 283, 713, and 1085 cm–1). An additional peak at 2328 cm–1 was assigned to N2. These results match those for fluid inclusions found in Colombian emeralds (Giuliani et al., 1994), but SEM is needed to identify the different complex mixed salts and daughter minerals. The shape of the inclusions was usually irregular, with numerous branches. In rare cases they appeared needle-like (figure 3C) or jagged (figure 3D).
Under darkfield illumination, tube-like growth features (figure 5) were found in 10 of the 11 Musakashi samples. The tubes were oriented parallel to the prism faces of the crystal, a common feature in emeralds. Each sample had an evenly distributed green color except for one that displayed color banding ranging from strong green to colorless perpendicular to the c-axis and the growth tubes.

Solid inclusions were quite rare. Of the 11 emeralds, only four hosted mineral inclusions that were not part of multiphase inclusions. The most common crystal inclusions identified using Raman spectroscopy were colorless and transparent euhedral calcite crystals (figure 6, left). Also found were several opaque and metallic euhedral inclusions resembling iron oxide, possibly hematite or the martite variety of hematite (figure 6, center), and some whitish translucent crystals identified as cryolite (figure 6, right). The iron oxide minerals identified usually occur in granitic pegmatites, but here they appeared in an emerald that also hosted pyrite and calcite inclusions.

Kafubu, Zambia. Most of the inclusions in the Kafubu samples were multiphase and rectangular in shape (figure 7), but some were quite irregular in outline (figures 8 and 9). These inclusions typically hosted some liquid and a gas bubble, but in several cases it was possible to see a solid third phase. Usually the associated crystal had very low relief. When the inclusions were studied between crossed polarizers, the crystal showed evidence of being doubly refractive (figure 9). This was very different from our observations of the Musakashi emeralds, which had at least two singly refractive crystals (halides) trapped within the multiphase inclusions.


Another interesting observation of the Kafubu emeralds was that when the inclusion and the gas bubble were flat, we could estimate the size ratio between them. In these samples, the gas bubble appeared to contain one-third to one-half the volume of the multiphase inclusion at room temperature. This was much larger than the gas bubble observed in emeralds from Musakashi, which indicates considerably different temperature and pressure conditions of formation and possibly very different fluid composition. These observations suggest a different geologic background.
Solid inclusions with no associated liquid or gas inclusions were quite common in all the samples from Kafubu. One of the authors (VP) visited Kagem in 2011 and 2012 and found that the emeralds there were commonly associated with quartz, pyrite, dark brown to black tourmaline, mica, and chlorite (figure 10). The most common crystal inclusions found had dark, opaque, and dendritic features, identified by Raman spectroscopy as pyrolusite, amphibole, and tourmaline (figure 11), as well as chlorite and mica. These inclusions offer telltale features that reflect the mineral associations found at the site.


Panjshir Valley, Afghanistan. Most of the inclusions in emeralds from the Panjshir Valley are multiphase. These typically have an elongated needle-like shape (figures 12 and 13), but they may also display an irregular (figure 14) or even jagged aspect (figure 12). These inclusions often host several cubic to rounded transparent crystals, and sometimes small, dark opaque crystals. Examined under crossed polarizers, the cubic crystals appeared to be singly refractive and the small rounded crystals appeared doubly refractive (again, see figure 12). These observations were identical to those previously reported (Bowersox et al., 1991). The gas bubble appeared to be smaller than the main crystal inclusion (which was usually cubic).


Davdar, China. Most of the inclusions in the samples from Davdar were multiphase. These were often jagged or irregular in shape (figures 15–17) and occasionally needle-like (figure 16). Some fluid inclusions contained two halide cubes (figure 16), as reported previously (Marshall et al., 2012). In these emeralds, the gas bubble was smaller than the whole inclusion and usually somewhat smaller than the associated cubic crystals.


Colombia. The most common inclusion in the Colombian emeralds was a jagged multiphase inclusion hosting a gas bubble and one or more cubic crystals (figures 18–20). In these stones, the gas bubble was usually smaller than the whole inclusion and no larger than the associated cubic crystal. Many of these emeralds also contained a tiny dark opaque crystal (figures 18 and 20, right) and clusters of daughter crystals, usually irregularly shaped (figures 19, bottom, and 20, left). These daughter crystals are related to various carbonate compounds (Giuliani et al., 1994). Most of the multiphase inclusions had the classic jagged shape associated with Colombian emeralds. In several cases the shape was more elongated, like a blade (figure 20, center), and occasionally irregular (figure 20, right).


UV-Vis-NIR Spectroscopy. The samples collected for UV-Vis-NIR spectroscopy were fabricated as optical wafers oriented either perpendicular or parallel to the crystal’s c-axis—with the exception of emeralds from Musakashi, which were either faceted or contained a single polished window. In this study, UV-Vis-NIR spectra characterized the following chromophores for emerald (Wood and Nassau, 1968):
| Cation | Identifying absorption characteristic | Possible geographic origin |
| Cr3+ | Bands at approximately 430 and 600 nm (ω), and at approximately 420 and 630 nm (ε) Lines at 476, 680, and 683 nm | Musakashi, Kafubu, Davdar, Panjshir, Colombia |
| Fe2+ | A band at 620 nm (ε), and a broad band at approximately 810 nm (ω, ε) | Strong: Kafubu Moderate: Davdar, Panjshir |
| Fe3+ | Narrow bands at 372 (ω) and 465 nm (ω, ε), and a band at approximately 400 nm (ω, ε) | Kafubu, Panjshir |
| V3+ | Bands at approximately 400 nm (ω) and 654 (ε) | Strong: Davdar, Columbia |
Zambia. In the 11 unoriented samples from Musakashi, the UV-Vis spectra displayed minimum absorptions at about 348 and 510 nm for the ordinary ray. For octahedral Al3+ in emeralds, substituted Cr3+ exhibited bands at 430 and 600 nm for the ordinary ray and lines at 476, 680, and 683 nm. These emeralds showed no significant Fe2+-related absorption features in the NIR region, and no Fe3+ was observed (figure 21A).

The nine fabricated samples from Kafubu all displayed the same absorptions: UV-Vis minima at 367 and 514 nm for the ordinary ray, and at 390 and 500 nm for the extraordinary ray. Moreover, a narrow Fe3+ band was observed at 372 nm in the ordinary ray but not the extraordinary ray, and a strong Fe2+ band at around at 810 nm was recorded (figure 21B).
Afghanistan. Nine fabricated samples were studied. Their UV-Vis spectra showed the Fe3+ peak at 372 nm for the ordinary ray and moderate Fe2+ absorption at 810 nm, similar to Kafubu emeralds. Yet some of the Panjshir samples appeared to contain no Fe3+, due to a low iron concentration, and they also exhibited peak heights at 810 nm that were lower than in the Kafubu samples (figure 21C).
China. Ten samples were measured, but only three were fabricated perpendicular or parallel to the c-axis. A representative UV-Vis spectrum is displayed in figure 21D. Davdar and Musakashi emeralds presented similar spectra, but with higher Fe2+ absorption in the NIR region of the former. But no Fe3+ features were observed, and strong V3+ absorptions were detected.
Colombia. The eight fabricated samples from Chivor, Coscuez, and Muzo exhibited UV-Vis spectra similar to those of Musakashi emeralds. Neither Fe2+ nor Fe3+ were observed. Absorptions corresponding to V3+ were present at about 400 and 654 nm (figure 21E).
FTIR Spectroscopy. FTIR spectra were recorded in the 400–7800 cm–1 region, with the major area of interest between 4500 and 7500 cm–1—specifically, the area related to water molecule vibrations. The resulting spectra indicated that the emeralds could be divided according to type I and II water molecule assignments (Wood and Nassau, 1968; Schwarz and Henn, 1992). Type I water molecules are oriented in the channels, not linking to other alkali metal ions, and their H-H direction is parallel to the c-axis. Type II molecules are located adjacent to alkali metal ions in the channel, and their H-H direction is perpendicular to the c-axis.
All of the emeralds contained type I water molecules except the samples from Kafubu (figure 22). The extraordinary ray plots of type I emeralds each exhibited a 7140 cm–1 peak that was more intense than the peaks found at 7095 and 7072 cm–1. The plots from type II emeralds displayed their highest-intensity peak at 7095 cm–1. These results matched previous reports (Wood and Nassau, 1968; Schwarz and Henn, 1992) that assigned the 7140 cm–1 peak to type I water molecules and the 7095 cm–1 peak to type II water molecules.

Trace-Element Analysis. All 84 emeralds from the five different localities were analyzed using LA-ICP-MS (table 2).
Zambia. The Musakashi emeralds shared similar trace-element chemistry with the Colombian samples. They contained low concentrations of alkali metals (Li, Na, K, Rb, and Cs); Mg, and Fe, as well as minor traces of Ni. Total alkali ion concentrations averaged 4250 ppmw. In terms of chromophore elements, the concentrations of Cr were greater than V, and the Cr/V ratio ranged between 1.7 and 5.3. Fe content varied from 680 to 1,490 ppmw. Trace amounts of Ni were also present.
The samples from Kafubu were rich in the trace elements Li, Na, K, Rb, Cs, Mg, and Fe, as well as Ti, Sc, Mn, Ni, and Zn. Total alkali ion concentration was as high as 34,747 ppmw; Mg and Fe contents averaged 15,004 and 8,621 ppmw, respectively. The chromophore elements Cr and V varied from 733 to 4,330 ppmw for Cr and from 71 to 180 ppmw for V; the Cr/V ratio was between 8 and 40. Small amounts of Sc were detected, from 12 to 75 ppmw. Significant traces of Mn, Ni, and Zn were also present.
Afghanistan. Afghan emeralds from Panjshir contained on average 10,780 ppmw of alkali ions. The chromophore elements Cr and V ranged from 118 to 4,730 ppmw and from 255 to 3,680 ppmw, respectively. The Cr/V ratio was 0.3 to 3.3. Iron contents ranged from 1,010 to 9,820 ppmw. Scandium contents were detected up to 2,290 ppmw, the highest concentration for this element in our study.
China. The emeralds from Davdar contained relatively lower amounts of combined alkali ions, 8,835 ppmw on average. Their green color was caused by the presence of both Cr and V, which varied from 146 to 5,630 ppmw for Cr and from 657 to 6,960 ppmw for V. The ratio for Cr/V was 0.1 to 1.0. Iron concentrations ranged up to 4,350 ppmw.
Colombia. All the Colombian emeralds contained low concentrations of alkali metals (Li, Na, K, Rb, and Cs), as well as Mg and Fe. Total alkali ion concentrations averaged 4,725 ppmw. The chromophore elements Cr and V ranged from 172 to 10,700 ppmw for Cr and from 218 to 10,100 ppmw for V; the Cr/V ratio was between 0.04 and 3.5. La Pita contained higher Cr and V than the other Colombian mines. Overall, the Colombian emeralds contained the lowest Fe concentrations in this study, from 117 to 2,030 ppmw.
DISCUSSION
Geology. Several summaries describing the geology of major emerald deposits are available in the gemological and geological literature (Giard, 1998; Behmenburg, 2002; Groat et al., 2008), but very few have dealt with the newer deposits such as Davdar or Musakashi. The mention by Klemm (2010) of sandstone as a possible host rock for Musakashi emeralds is quite interesting, as calcareous sandstone was also identified as the main host rock of the emeralds from Davdar (Pardieu and Soubiraa, 2006; Michelou and Pardieu, 2009; Schwarz and Pardieu, 2009; Marshall et al., 2012). It is very intriguing to observe similar multiphase inclusions in the stones from these two deposits.
Multiphase Inclusions. The discovery of three-phase inclusions in samples reportedly from Musakashi was rather surprising. While these inclusions are similar to those in emeralds from Colombia, Afghanistan, and China (Xin Jiang), specimens from the neighboring Kafubu area of Zambia contain two-phase inclusions or three-phase inclusions with crystals that are only visible under cross-polarized light (Zwaan et al., 2005). The stones reportedly from Musakashi had multiphase inclusions hosting not only liquid and gas bubbles but also several solid phases. Usually at least two crystals could be seen: one cubic, one more rounded, and often several smaller ones ranging from transparent colorless to opaque black. This was not typically observed in our Colombian samples. The cubic crystals, the gas phase, and the daughter crystals were identified by Raman spectroscopy as a halide, CO2, and carbonate, respectively. These results are identical to those reported for fluid inclusions in Colombian emerald (Giuliani et al., 1994). The shape of the cavity housing the multiphase inclusions in our Musakashi samples was usually quite irregular, not unlike those seen in those from Colombia, Afghanistan, and China. In some cases the cavity’s shape was similar to the jagged form commonly found in Colombian emeralds or the elongated needle shape typical of Panjshir emeralds. But for the most part, the cavities in the Musakashi samples were similar to those associated with Davdar.
Unlike the Kafubu emeralds, the multiphase inclusions in our Musakashi samples also contained more crystals with single refraction than double refraction. The gas bubbles in Musakashi multiphase inclusions were smaller than those found in Kafubu material. These results reflect the possibility that different temperature and pressure conditions, geologic backgrounds, and fluid compositions existed when the emeralds from these two neighboring locations formed.
Spectroscopy. UV-Vis-NIR. The UV-Vis-NIR spectra were characterized by absorptions that resulted from the presence of the chromophores chromium, vanadium, and iron, illustrated in figure 21. The Musakashi emeralds shared similar absorption characteristics with those from Colombia and Davdar, but with lower V3+ absorption. Furthermore, the Musakashi samples showed no significant Fe2+-related absorption features at about 810 nm, and no Fe3+ absorption at about 372 nm, which distinguished them from Davdar and most of the Kafubu material. Kafubu and Panjshir samples showed a strong narrow absorption band at 372 nm corresponding to Fe3+, as well as a broad band around 810 nm corresponding to Fe2+. The Davdar emeralds displayed only the Fe2+-related broad band. The 810 nm peak is related to Fe content, though their relationship has not been clearly established yet. With higher iron concentration, the peak intensity at 810 nm increased, along with the peak at 372 nm. In this study, we measured the 810 nm peak height of the ordinary ray, which ranged from 7 to 11 cm–1 (Kafubu) and from 1 to 5 cm–1 (Panjshir).
The FTIR spectra recorded for the type I emerald samples all showed a 7140 cm–1 peak, higher than those at 7095 and 7072 cm–1 for the extraordinary ray, related to low alkali metals contents in the channels of the beryl structure. (Again, Kafubu was the only locality that yielded type II samples.) Total alkaline ion concentration, determined using LA-ICP-MS, showed no relationship with the peak at 7140 cm–1. This was because some of the alkali metals may exist in sites other than those that influence the water spectrum. For example, Li may occur in Be or Si sites, depending on ion sizes.
Trace-Element Variations. The samples from Musakashi were characterized by LA-ICP-MS as having low concentrations of alkali metals and Mg, and high Al content. Most of the Kafubu emeralds seemed to have an abundance of the alkali metals Li, Na, K, Rb, and Cs. Various log-log population fields generated from the trace-element data collected (with multiphase inclusions) showed great potential in distinguishing geographic origin (figures 23–25). To explore this further, we added published data for Brazilian emeralds from Rio Grande do Norte (Zwaan et al., 2012), which confirmed the usefulness of this separation criterion. A log-log plot of Li versus Cs content can easily separate the two Zambian deposits (figure 23). The same type of plot can generally distinguish Panjshir and Davdar from Musakashi and Colombian emeralds, even with a small overlapping area. This plot may also help differentiate between Davdar and Panjshir, as the areas overlap only slightly. We compare this to Schwarz and Pardieu (2009), whose diagram of Ga versus Fe showed nearly complete overlapping between Davdar and Panjshir, rendering it impossible to distinguish between the two locations. As the population fields in the log-log plot of Li vs. Cs overlap for Musakashi and all Colombian emeralds, a plot of Fe vs. K and Fe vs. Ga proved useful in separating between these two origins (figures 24 and 25). In addition, the recorded Ni content was just above the detection limit in emeralds from Musakashi but below the detection limit in most Colombian samples. Average Fe concentrations were highest in samples from Kafubu. Moreover, the Panjshir emeralds contained higher Sc, which was very useful in distinguishing them.


CONCLUSIONS
For many years, the observation of three-phase inclusions in emeralds was considered a reliable indicator of Colombian origin. But with the arrival in the market of emeralds from Panjshir (Afghanistan), Davdar (China), and Kafubu and Musakashi (Zambia) that may also display three-phase inclusions, origin determination became more complicated. There are some notable differences, however.
Emeralds from the Musakashi deposit are of particular interest, as their internal features are quite different from those found in the well-known deposits in the neighboring Kafubu area. The inclusion scene within the Musakashi emeralds is indeed dominated by multiphase inclusions that are commonly associated with Colombian origin. Nevertheless, the outline and make-up of these multiphase inclusions may be more irregular than those typical of Colombian deposits. Furthermore, the tendency of Musakashi emeralds to have at least two crystals associated with a gas bubble may raise questions about a possible Zambian origin.
Emeralds from Panjshir, Afghanistan, are often characterized by elongated needle-shaped multiphase inclusions rather than the traditional jagged type often seen in Colombian material. Furthermore, Afghan emeralds often host up to 10 cubic to rounded transparent crystals, and sometimes small dark, opaque crystals. When examined between crossed polarizers, the cubic crystals appeared to be singly refractive and the small rounded crystals appeared doubly refractive. Such features are not typical of Colombian emeralds.
The multiphase inclusions in emeralds from Davdar, China, can be very similar to those in emeralds from Colombian deposits. Many of the multiphase inclusions found in Davdar specimens are jagged and have only one cubic crystal. But the shape of these multiphase inclusions is usually more irregular (sometimes needle-like) than the jagged outline typically observed in Colombian emeralds.
Studying the inclusion scene in these emeralds can be quite confusing, but spectroscopy and trace-element chemistry can provide additional valuable tools to distinguish between them. The presence or absence of Fe2+ and Fe3+ and the varying intensity of V3+ absorption may suggest different countries of origin. More generally, plotting the log-log results from the LA-ICP-MS data for Cs, Li, K, Ga, and Fe resulted in population fields that also appear very promising as a tool in determining the origin of emeralds.

In many cases, the combination of the inclusion scene, UV-Vis-NIR absorption data, and trace-element chemistry (summarized in table 3) can help the gemologist determine the origin of emeralds with three-phase or multiphase inclusions.


