ABSTRACT
Moroccan agates from Sidi Rahal occur within Triassic basaltoids as lens-shaped specimens in sizes up to 25 cm. Their coloration and internal structure are quite specific and characteristic for this region. The pink outer rim is composed of opal-CT. The layer within it, usually red or red-brown, contains a significant concentration of Fe compounds (hematite and goethite) that are responsible for this zone’s color. The nodules’ interior, usually blue-gray or white-gray, is formed of fibrous low-α quartz (a low-temperature polymorph of quartz) with minor amounts of moganite. The presence of moganite and Fe compound inclusions suggests that the agate’s formation was induced by Fe3+ activity in silica-rich fluids. Other solid inclusions such as Cu sulfides, Ti oxides, calcite, and an organic substance were incorporated during post-magmatic, hydrothermal, or hypogenic conditions.
INTRODUCTION
Agate is a unique natural wonder, with no two identical specimens: Each has a different pattern and color. It occurs in various volcanic and sedimentary rocks in nearly all countries on earth, with the most famous gems found in Brazil, India, and Madagascar (e.g., Ball and Burns, 1975; Breiter and Pasava, 1984; Priester, 1999; Moxon et al., 2006; Strieder and Heemann, 2006; Cross, 2008; Götze et al., 2009). Agates consist mainly of fibrous microcrystalline low-α quartz—i.e., macroscopic banded chalcedony (Götze, 2000). Graetsch et al. (1987), Heaney and Post (1992), and Heaney (1995) noted that in agates and other microcrystalline silica phases, low-α quartz commonly forms intergrowths with moganite, a monoclinic silica phase first described by Flörke et al. (1976, 1984) and approved as a new mineral by the International Mineralogical Association in 1999 (Grice and Ferraris, 2000).
Agates are a microcrystalline variety of silica, generally defined as banded chalcedony, but they also contain a variety of other silica polymorphs (Götze et al., 2001). The mechanism of rhythmic bands that produces agate is still not completely understood (Beaster, 2005). A number of explanations have been proposed for this banded texture and the rhythmic segregation of the silica polymorphs (see French et al., 2013). The prevailing hypothesis is that voids in volcanic rock are filled in cycles, from the rim to the center. Silica-rich fluids are believed to have penetrated the rocks through microfissures or infiltration canals. The shape and width of the zones and the general pattern of the agate all depend on the concentration of silica in the fluids, as well as the temperature, pressure, and timing of the fluid influxes. Other elements found in the fluids (Fe, Ti, Mn, and others) affect only the coloration of the agate zones. At the final stage of formation, mainly in the center of the void, idiomorphic quartz of different colors—brown, smoky quartz, amethyst, and rock crystal—can crystallize, sometimes accompanied by calcite, hematite, goethite, barite, and other minerals (Heaney, 1993; Götze et al., 2001; Moxon and Rios, 2004; French et al., 2013).
Moroccan agates from the Atlas Mountains were first described in the 1940s (Jahn et al., 2003), but only recently have they drawn the interest of collectors worldwide. The specimens are commonly white-gray, blue-gray, red-gray, and brown-gray, and are found in sizes up to 25 cm in diameter (Zenz, 2005a). The scientific literature has dealt mainly with the geology of the deposits (e.g., Jahn et al., 2003; Zenz, 2005b, 2009; Gottschaller, 2012; Mayer, 2012; Mohr, 2012; Schwarz, 2012). This paper focuses instead on the gemological characteristics of these agates.
The town of Sidi Rahal is located about 60 km east of Marrakesh. The agate outcrops occur nearby in an area approximately 40–50 km long and 5 km wide. Although the region is abundant with these gems, it is not being worked on a commercial scale. Every day locals look for agate to sell to gem collectors from around the world. The most spectacular specimens are used for carvings and cabochons.
In the present study, we investigate the distribution of different silica phases within agate from Sidi Rahal and provide initial characterization of solid inclusions found in the colored zones. Observations of the samples’ microtextures, and chemical and mineralogical analysis of the solid inclusions found in the matrix, are considered with regard to how the agates formed.
GEOLOGICAL SETTING
Morocco’s largest agate deposits are found in Tizi-n-Tichka, Asni, and Sidi Rahal, in the northwestern part of the Atlas Mountains; detailed geological maps of this region are presented by Jahn et al. (2003). The Atlas Mountains consist mainly of Paleozoic crystalline schists, quartzites, limestones, and Paleogene volcanic rocks associated with Alpine orogenic tectonic movements (Babault et al., 2013). The upper part of the mountains is covered with folded Jurassic and Cretaceous limestone and lower Paleogene flysch rocks (schists-sandstone).
Triassic basaltoids as thick as 3 km outcrop in the vicinity of Sidi Rahal. This semicircular volcanic outcropping covers a 110 × 70 km area. The basaltoids frequently contain spherical or lens-shaped geodes filled with SiO2 minerals (Verdier, 1971). Agates from Sidi Rahal are mainly gray-white or red-gray, with a red-orange or pink external rim. In the inner part of the geode, white-gray chalcedony coexists with colorless quartz. Cutting and polishing reveal landscape, stalactite, or pipe-shaped patterns (figure 1). Yet some are also monocentric (see the classification proposed by Campos-Venuti, 2012), with a void in the center or filled with the youngest generation of silica polymorph.

MATERIALS AND METHODS
Ten agate samples were provided by Polish gem collectors Jacek Szczerba and Remigiusz Molenda, who personally gathered the nodules in 2010 and 2011. Mineralogical characterization of selected nodules was carried out with a transmission microscope, a scanning electron microscope (SEM-EDS and SEM-CL), X-ray fluorescence (XRF) microspectroscopy, and Raman microspectroscopy.
The specimens were examined with an Olympus BX 51 polarizing microscope with a magnification range of 40× to 400×. Backscattered electron observations were performed on polished, carbon-coated sections using an FEI Quanta 200 field emission gun scanning electron microscope equipped with energy-dispersive spectroscopy and cathodoluminescence detectors. The system was operated at 20 kV accelerating voltage in high-vacuum mode. Scanning electron microscopy provides information on the quantity of solid inclusions and their general chemical composition. Combined with Raman spectroscopy, it enables the user to identify all mineral and organic phases found within an agate’s matrix.
Raman spectra of silica phases and solid inclusions were recorded with a Renishaw InVia Raman microspectrometer coupled with a Leica microscope featuring 20×, 50×, and 100× magnification objectives. Two selected samples were excited with a 785 nm high-power near-infrared (HP NIR) laser. The laser power and excitation time were optimized to the optic character of the samples. The laser focus diameter was approximately 1–2 µm. It should be noted that almost no sample preparation was performed. The two samples were broken with a geological hammer, and the fractured surface was cleaned carefully with distilled water and acetone before measurements were made to avoid any contamination.
Raman maps were recorded with a Thermo Scientific DXR Raman microscope on selected areas (190 × 150 µm), using a step size of 3 µm. The agate sample was excited with a 780 nm laser. We recorded the most intense bands for quartz (460 cm−1), opal (412 cm−1), and moganite (501 cm−1) in each point of the analytical grid.
Two-dimensional maps of elemental abundance were created with a laboratory setup consisting of a low-power X-ray tube with a molybdenum anode and a silicon drift detector, or SDD (Wróbel et al., 2012). The measurements were performed in typical 45°/45° geometry, where the angles between impinging beam, sample normal, and detector axis equaled 45°. The X-ray tube voltage and current were 50 kV and 1 mA, respectively. Primary radiation from the X-ray tube was focused with a polycapillary lens into a Gaussian-shaped beam with a spot size of at least 16.4 µm full width at half maximum (FWHM). The sample surface was placed out of focus of the primary radiation beam, which had an effective size of approximately 50 µm FWHM. The samples were mounted between two 2.5 μm thick Mylar films stretched across a plastic holder. Mounting the holder onto a motorized stage allowed the sample to be rotated in three directions with micrometer resolution.
For the mapping of agate samples 1 and 2, the step size (pixel size) equaled 150 μm in the horizontal and vertical directions. The first map measured 128 × 134 pixels, equal to 19.05 × 19.95 mm2. The second map was 108 × 134 pixels, or 16.05 × 19.95 mm2. The sample acquisition times were 2 seconds per pixel and 3 seconds per pixel, respectively. The net intensities of the characteristic lines were calculated with AXIL-QXAS software using nonlinear least-squares fitting for peak deconvolution. Due to the number of measured points, we evaluated the spectra automatically using batch mode. Using our own LabVIEW scripts, we reconstructed maps of characteristic line intensities.
RESULTS
The vast majority of agate from Sidi Rahal exhibits two rim layers: pink-orange (outer) and red-brown (inner). Their thickness ranges from 0.1 to 1.0 cm. The color of the inner zone likely results from fine Fe-bearing pigments such as oxides and hydroxides scattered within the silica matrix (figures 2A, 2C, and 2D). Internally, the nodules are mostly gray-blue or white. Sometimes these regions are intersected by coarse groups of thin needle-like inclusions, either red-brown or black, that we initially attributed to Fe compounds (figures 2B and 2D). Within each zone, numerous infiltration canals called osculum were observed with the unaided eye.

Under the polarizing microscope in transmitted light, the gray-blue region inside the nodule appeared to be composed of a microcrystalline silica phase, while the internal white crustal zones contained idiomorphic quartz crystals. The microcrystalline silica phase crystallized as twisted crystals forming fibrous radial and fan-like (spherulitic) microtextures (figure 3). In the external part of the agates, the distinct boundaries between the microlayers were emphasized by thin laminae of nontransparent phases. Internally, the boundaries were almost invisible, indicating a continuous and even supply of silica-bearing water solutions. The dark brown zigzag-like inclusions consisted of an organic substance that luminesced under a long-wave UV lamp (figure 4).


Using SEM-EDS and SEM-CL, we easily observed the various silica generations forming mosaic microtextures with different luminescence colors. The SEM-CL images revealed not only the sequence of the silica phases but also the growth direction of the crystals from the rim to the center of the agate void (figure 5). Solid mineral inclusions found in the silica matrix were comprised mainly of (1) pyroxene, typically occurring in the contact zone between the agate and the basaltoid host rock; (2) Fe compounds forming regular round crystals arranged into thin layers between silica zones; or (3) xenomorphic heterogeneous crystals scattered randomly within the matrix. Some Fe compounds, possibly hydroxides, also formed needle-like inclusions. In the central part of the nodule, tiny single crystals of Cu sulfides were accompanied by idiomorphic quartz (figure 6).


The Raman spectra of different silica polymorphs, measured from selected areas of the agates, are presented in figure 7. Band assignments and comparisons with references are listed in table 1. The distinctive 460 and 501 cm−1 marker bands are related to symmetric stretching-bending vibrations of low-α quartz and moganite, respectively (Götze et al., 1998). The interior of the agate nodules from Sidi Rahal is a mixture of these two silica polymorphs. The Raman spectrum of the external pink-orange layer revealed the presence of opal-CT with the characteristic band at 410 cm−1 (Pop et al., 2004). 2D mapping measurements showed that the opal-CT occurs almost exclusively in the rim, whereas the distribution of low-α quartz and moganite varies within each agate and also between samples (figure 8). The low-α quartz seems to predominate over the moganite, which occurs only in the nodules’ visible white regions.


Interesting accumulations of dark brown inclusions (figure 9) were identified with Raman microspectroscopy. These complex heterogeneous inclusions consist of several different phases. Points 2–4 have very similar spectra, with the predominant band at approximately 500 cm−1 attributed to feldspar. Curve fitting of the wide 534 cm−1 band gives two components: 519 and 549 cm−1, originating from anorthite and bytownite, respectively (Mernagh, 1991). In the first spectrum, the high-frequency shoulder of the 410 cm−1 band located at approximately 434 cm−1 and the broad, weak band at 686 cm−1 likely indicate the presence of nanocrystalline TiO2 (figure 10).


The presence of carbonaceous matter is very clearly marked by 1330 and 1606 cm−1 bands (again, see figure 10). Resolving this second band gives two bands: one at 1599 cm−1, the other a D1 band at 1615 cm−1, forming a shoulder on the G band. These bands are characteristic for graphite and carbonaceous matter. The 1330 cm−1 band (called the D band) is due to disorder-induced first-order Raman mode, and the 1599 cm−1 band to first-order E2g Raman mode (G band); the 1615 cm−1 band is called the D1 band (figure 10, inset, and figure 11; see Beyssac et al., 2003). The D1 band always occurs with the D band, and its intensity increases with a decreasing degree of organization. In the second-order region (2200–3400 cm−1) there also appear weaker peaks, representing poorly organized carbonaceous matter, attributed to overtone or combination scattering (table 2).
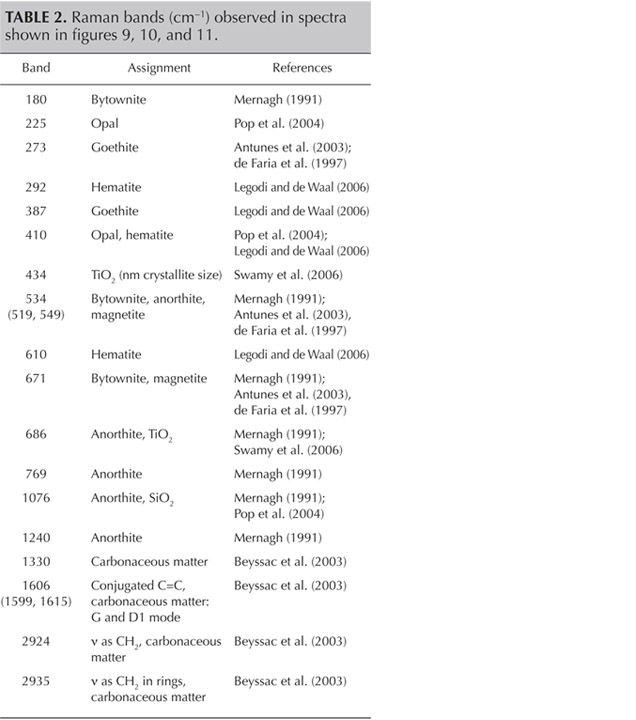
Another component of this complex inclusion is goethite, indicated by the characteristic band at 387 cm−1 (390 cm−1) observed in points 2–4. This band is caused by symmetric stretching vibrations of Fe-O-Fe-OH (Legodi and de Waal, 2006). Hematite in the agate matrix is evidenced by marker bands at 292, 410, and 610 cm−1 (again, see figure 10). These bands are attributed to symmetric bending vibrations of Fe-O (Legodi and de Waal, 2006).
Figure 11 presents another example of characteristic carbonaceous matter bands within an agate matrix (Beyssac et al., 2003). The 1585 cm−1 peak (E2g mode) corresponding to the stretching vibration in the aromatic layers is another example of the G band. The additional band for poorly organized carbonaceous matter, the D band, appears in the first-order region around 1330 cm−1. Positions and half-widths of the G and D bands in this example indicate the different degree of ordering of carbonaceous matter compared to figure 10, spectrum 1. Greater intensity of the D band (1330 cm−1) with respect to the G band (1585 cm−1) indicates a significant carbonaceous matter disorder in this inclusion. It is believed that organized carbonaceous matter is developed from the less homogenous organic precursors in the process of solidification of fluid inclusions (Wopenka and Pasteris, 1993). This process may lead to the formation of graphite in rocks, as we have observed in Afghan tourmalines (Wesełucha-Birczynska and Natkaniec-Nowak, 2011).

The XRF spectrum taken from sample 1 (figure 12) shows characteristic lines for Si, Cl, K, Ca, Fe, and Cu. Figures 13 and 14 present the microscopic view of the measured samples and maps of characteristic Kα X-ray intensities of Si, Ca, Cl, Cu, and Fe in samples 1 and 2. As would be expected, silicon is uniformly distributed in both samples. The other elements are distributed unevenly. In both agates the highest concentrations of Cl, Ca, and Fe are distributed close to the edges. Whereas the inner part of sample 1 shows a very low abundance of Ca and Fe, these elements are evenly distributed throughout sample 2. It is worth noting that fragments containing large amounts of Cl, Ca, and Fe are quite narrow, and concentrations of these elements decrease toward the center of both samples. The varying elemental concentration within the mineral can result from the scattering of Ca, Cl, and Fe during crystal growth. Cu, on the other hand, is deposited in irregular structures measuring about 2 mm or less (sample 1) or in single points less than 0.5 mm in diameter (sample 2). For both samples, Cl and Ca show a very similar pattern; the correlations between Cl-Kα and Ca-Kα intensities are shown in figure 15. The positive correlation coefficients (R) calculated for these elements were 0.94 and 0.89 for samples 1 and 2, respectively.


DISCUSSION
Moroccan agates from Sidi Rahal occurring within Triassic basaltoids are composed mainly of low-α quartz only locally intergrown with moganite. The maturation of cryptocrystalline silica phases (the transformation of metastable moganite into low-α quartz) generally lowers the moganite content (Moxon and Rios, 2004) over tens of millions of years (Heaney, 1995). Thus, Pop et al. (2004) proposed moganite content as a tool for age evaluation and noted no direct correlation with the geological age of the agate’s host rock. Nevertheless, their investigation of the oldest (Cretaceous) microcrystalline samples showed only minor moganite content, while the youngest chalcedony had a relatively high concentration of it. Moganite has generally been identified as an indicator of evaporative sedimentation, although non-evaporitic rocks often contain 5.0–15.0 wt.% moganite (Heaney, 1995). The results of our Raman studies are consistent with these observations, as Triassic agates from Sidi Rahal contain only minor amounts of moganite (figures 7 and 8; table 1).
Pop et al. (2004) noted that moganite crystallization is favored by alkaline fluid composition combined with the high activity of ferric iron. As a result, the absence of moganite in weathered and hydrothermally altered silica samples may be a useful measure of fluid-rock interactions (Heaney, 1995). Agates from Sidi Rahal often contain thin layers with an orange-red, red, or brown-red color, and these are associated with the presence of Fe compounds. Some Fe-bearing phases form linear aggregates, suggesting a continuous supply of iron-bearing fluids to the basaltoid nodule. Hence, the occurrence of both Fe compounds strongly suggests that the crystallization of these agates was induced by Fe3+-rich fluids.
The most widespread inclusions found in the samples were hematite and goethite, which probably formed during hydrothermal conditions of post-magmatic activities. The presence of Cu sulfides and Ti oxides scattered within the agate matrix might also be attributed to hydrothermal fluids. Only traces of titanium phases could have occurred, as XRF analyses did not detect their presence in the agate matrix. In a few instances, the agates’ voids or some of their microfissures were filled with idiomorphic calcite crystals. The formation of this carbonate phase is associated with a hypogenic process (referring to a mineral deposit formed from aqueous solutions that originated at depth and ascended through the crust). Other solid inclusions occurring within the silica matrix are pyroxene, plagioclase, and an organic substance forming irregularly scattered aggregates. Pyroxene and plagioclase occur only in the outer portions, and these are typical components of the basaltoids’ host rock. The organic substance was probably incorporated into the agate under late hydrothermal, hypogenic conditions by exposure to groundwater, or it might be of algal-marine origin. To determine the exact origin of the organic substance, we plan to carry out stable carbon isotope analyses in the next stage of our investigations, as we did with the “bituminous” agates from Nowy Kos´ciół, Poland (Dumanska-Słowik et al., 2008).
In XRF maps of agate from Sidi Rahal, the location and distribution of Ca and Cl are mutually correlated (figure 15). Such a strong correlation indicates that the concentration of these elements may be related to the same mechanism. They could have been incorporated into the nodules from a marine environment. Similarly, the presence of moganite, the silica phase typical of evaporative sedimentation, and some organic components found in the agates supports the thesis that a marine environment affected the formation of these beautiful gems. Undoubtedly, the crystallization of agates from Sidi Rahal lasted millions of years and took place in stages, influenced by various geochemical processes of terrestrial and marine environments.
CONCLUDING REMARKS
Agates from Sidi Rahal are composed of three silica phases: low-α quartz, moganite, and opal-CT. The latter occurs mainly in the nodules’ pink outer zone, while the interior consists of low-α quartz and moganite. The nodules’ red or brown-red layer results from linearly scattered Fe compounds (hematite). Goethite usually appears as rusty brown forms in a characteristic coarse grouping of needles.
The most common solid inclusions found within the agate matrix include pyroxene, calcium-rich plagioclase, hematite, goethite, and Ti and Cu compounds. Hydrothermal fluids seem to be responsible for the formation of iron, copper, and titanium phases within the agate’s microfissures. An organic substance forms tiny irregularly scattered or zigzag-like aggregates, mainly concentrated in the external and middle zones. The substance formed under hydrothermal, hypogenic conditions and may be of algal marine origin. Similarly, the presence of calcite, mainly filling the void, is connected to hypogenic processes.
The presence of red and brown-red external nodule layers enriched with scattered Fe pigments, as well as isolated aggregates of Fe oxides and hydroxides (hematite and goethite) in the whole mass of the nodules, suggests that agate crystallization was associated with the activity of Fe3+ in silica-bearing fluids. The higher moganite concentration in the inner part of the agate also indicates the alkaline character of the silica fluids. The significant concentration of Ca, Cl, and Fe in the nodules suggests that the formation of agates from Sidi Rahal was affected by both marine and terrestrial geochemical processes.
Similar patterns of silica polymorph growth within banded agate were observed by French et al. (2013), who attributed these gems’ formation to aqueous silica-rich fluid influxes, consistent with our observations of agates from Sidi Rahal.
Drs. Dumanska-Słowik (dumanska@uci.agh.edu.pl) and Natkaniec-Nowak are assistant professor and associate professor, respectively, in the Faculty of Geology, Geophysics, and Environmental Protection at the AGH University of Science and Technology in Krakow, Poland. Mr. Gaweł is a researcher at the Laboratory of Phase, Structural, Textural and Geochemical Analyses at the Faculty of Geology, Geophysics and Environmental Protection at the AGH University. Prof. Lankosz is a professor, and Mr. Wróbel a Ph.D. student, in the Faculty of Physics and Applied Computer Science at the AGH University. Dr. Wesełucha-Birczyn´ska is an associate professor in the Faculty of Chemistry at Jagiellonian University in Krakow.
Drs. Dumanska-Słowik (dumanska@uci.agh.edu.pl) and Natkaniec-Nowak are assistant professor and associate professor, respectively, in the Faculty of Geology, Geophysics, and Environmental Protection at the AGH University of Science and Technology in Krakow, Poland. Mr. Gaweł is a researcher at the Laboratory of Phase, Structural, Textural and Geochemical Analyses at the Faculty of Geology, Geophysics and Environmental Protection at the AGH University. Prof. Lankosz is a professor, and Mr. Wróbel a Ph.D. student, in the Faculty of Physics and Applied Computer Science at the AGH University. Dr. Wesełucha-Birczyn´ska is an associate professor in the Faculty of Chemistry at Jagiellonian University in Krakow.


