Analysis of Gemstones at GIA Laboratories
With decades of expertise and laboratory locations worldwide, GIA uses more advanced instrumentation that extends far beyond the boundaries of standard gemological testing. The comprehensive analysis of gemstones submitted to the laboratory ensures accurate identification and grading reports. These gemstones fall under five different categories: natural diamonds, natural colored diamonds, laboratory-grown diamonds, colored stones, and pearls.
GENERAL PROCEDURES
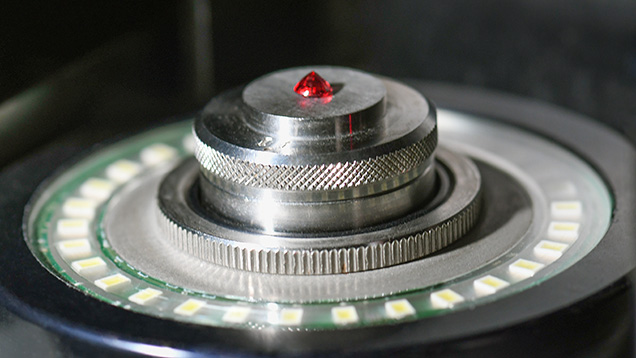
Once a stone is submitted, client information is withheld from the non-client-facing staff who conduct the analysis. This measure helps ensure an unbiased report. Before undergoing examination, each item is weighed and measured. All loose, faceted stones are assessed with a noncontact optical measurement device (figure 1) that projects the stone’s shadow to obtain exact measurements of angles and facets. If the stone is mounted, not faceted, or exceeds the device’s capacity, it is weighed and measured by hand.
Based on accurate measurements from the noncontact optical measurement device, the stone’s volume can be calculated. This provides the information needed to calculate the specific gravity. When this calculation is not possible for a loose stone, GIA gemologists turn to hydrostatic measurement as needed, using the weight of the stone in air and the weight of the stone suspended in water. After all necessary information related to weights and measurements has been obtained, the item is directed to the next required analysis for that material.
DIAMONDS
Stones submitted as diamonds are examined to verify whether they are natural or laboratory-grown. At this initial stage, a stone with a specific gravity of 3.52 is presumed to be diamond and analyzed using the GIA DiamondCheck. This device, created specifically for the laboratory, detects the presence or absence of nitrogen impurities in the stone’s infrared spectrum (figure 2). It separates diamonds into two categories: “Pass” (type I diamonds) or “Refer” (type II diamonds and laboratory-grown diamonds) (Breeding and Shigley, 2009).

Items that do not fall within the “Pass” or “Refer” categories are classified as “non-diamonds” and routed to the identification department for analysis. For example, topaz has a specific gravity of 3.52, the same as diamond. If a topaz were submitted for a diamond report, it would not pass the DiamondCheck step, as it has a different intrinsic infrared spectrum.
Referred diamonds are analyzed by senior gemologists who specialize in detecting laboratory-grown diamonds and potential treatments. Photoluminescence (PL) spectroscopy is used to assist with the identification of laboratory-grown diamonds manufactured by chemical vapor deposition (CVD) or high-pressure, high-temperature (HPHT) methods, as well as the detection of post-growth treatment. PL can also determine whether a colorless natural diamond has undergone HPHT treatment (Eaton-Magaña and Breeding, 2016).
Referred diamonds may also undergo DiamondView screening. This instrument uses ultraviolet light with a wavelength below 225 nm to excite luminescence. The luminescence emitted by the diamonds reveals growth structure characteristics that distinguish natural growth from laboratory growth using CVD or HPHT methods (McGuinness et al., 2020).
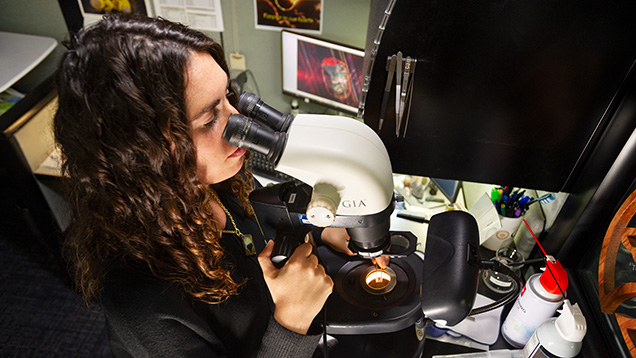

Both passed and referred diamonds are then evaluated by GIA graders in controlled environments that are standard across every GIA location. Multiple graders independently examine each diamond through a GIA gemological microscope and a 10× loupe (figure 3). They evaluate clarity by assessing the size, location, and visibility of all internal and external features. A clarity grade is ultimately assigned based on the GIA Clarity Scale. During clarity examination, the graders also confirm the presence or absence of treatments such as internal laser drilling, laser drill holes, and fracture filling (figure 4).
Diamonds are also evaluated for their color using the universal grading scale developed by GIA. This is done under controlled lighting using master stones with established color grades for reference. Diamonds without color are compared against the master stones using GIA’s D-to-Z color grading scale, in which “D” denotes colorless, with yellow, brown, or gray color saturation increasing to Z. (Color grades of S to Z can also be graded as light yellow, light brown, or light gray.) Colored diamonds with a saturated hue (e.g., yellow, pink, blue, and green) are graded against master stones to analyze the tone and saturation.

Diamonds that receive a W–Z color grade, as well as all colored diamonds, are examined by GIA gemologists to determine the origin of this color. Using analytical techniques, they can distinguish between natural color and color produced by artificial irradiation, HPHT treatment, or a combination of the two (figure 5). These techniques include ultraviolet/visible/near-infrared (UV-Vis-NIR) spectroscopy, Fourier-transform infrared (FTIR) spectroscopy, and photoluminescence (PL) spectroscopy.
UV-Vis-NIR spectroscopy measures absorption patterns within the ultraviolet to visible light range and into the near-infrared. As one of the initial tests, it plays a crucial role in color origin determination (Jin et al., 2024). Diamonds are cooled with liquid nitrogen to produce a clean spectrum, revealing optical defects that influence a diamond’s color (Shigley and Breeding, 2015). For example, a band at 550 nm is linked to plastic deformation, potentially causing pink or brown bodycolor (Eaton-Magaña et al., 2018). “Cape” features (N3 defect at 415.2 nm, along with N2 at 478 nm and two absorption peaks at 451 and 463 nm) contribute to a yellow color (Breeding et al., 2020). The interpretation of various optical defects, combined with input from other types of data, can help determine a diamond’s color origin.
FTIR spectroscopy measures absorption in the infrared region. For diamonds, it is mainly used to classify diamond type, which corresponds to the presence or absence of nitrogen and boron in the crystal lattice (Breeding and Ahline, 2024). Certain diamond types, as well as other features found in an IR spectrum, are associated with specific diamond colors or lattice defects (Breeding and Shigley, 2009). For example, isolated nitrogen appears in the infrared as C-centers that contribute a yellow to orange bodycolor (Breeding et al., 2020). FTIR also detects the presence of defects such as H1a, H1b, and H1c (1450, 4935, and 5165 cm–1), which commonly occur in type Ia yellow diamonds that have been exposed to either natural or artificial irradiation and annealing (Wang et al., 2005).
PL spectroscopy measures the fluorescence from a gemstone, typically when stimulated with lasers of various wavelengths (Eaton-Magaña et al., 2024). PL spectroscopy is a valuable tool for identifying certain gemstones such as ruby and sapphire. These have characteristic fluorescence spectra related to the presence of Cr3+, which fluoresces at a specific wavelength of 694 nm. The natural or laboratory-grown origin of diamonds can also be reliably determined using PL spectroscopy. In most cases, PL spectroscopy is also crucial for identifying the natural color origin of diamonds or potential treatments applied to enhance their appearance.
GIA gemologists collect all the data provided by advanced gemological testing and analyze it comprehensively. This information, along with the diamond’s suite of inclusions, enables them to reach a unanimous conclusion on the color origin.
COLORED STONES
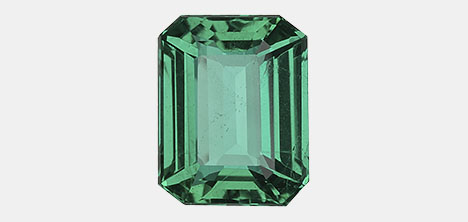
All colored stones are routed to GIA’s identification department, where gemologists assess each stone’s identity and potential treatments. Not every colored stone requires advanced gemological testing, which is used judiciously to support standard gemological testing as needed. The size and transparency of a gemstone will also determine which instruments are appropriate for its analysis. The stone must be able to fit within the machine and provide reliable data.
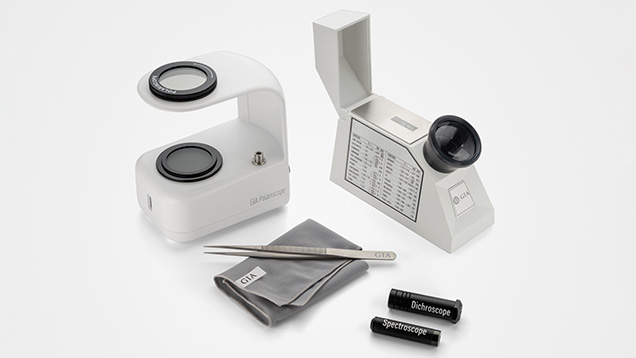
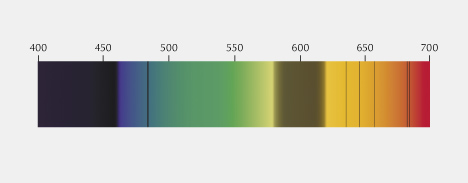
Standard gemological testing is the foundation of colored stone identification, using the methods taught in GIA’s Graduate Colored Stones program: the refractometer, polariscope, dichroscope, and handheld spectroscope (figure 6). Not all of these tests are applicable for every stone. In addition, gemologists test the stone’s specific gravity.
Colored stones are also assessed for their response to UV radiation, the portion of the electromagnetic spectrum from 10 to 400 nm. When UV radiation interacts with some gemstones, it causes them to emit visible light in the form of fluorescence or phosphorescence. This effect can be linked to the gemstone’s chemical composition, providing insights into its identity and any potential treatments applied. GIA uses two standardized UV lamps: a long-wave UV light with a wavelength of 365 nm and a short-wave light at 254 nm.

Two gemstones routinely checked under UV light are emerald and blue sapphire. Some fillers used for clarity enhancement of emeralds can fluoresce bright yellow to blue under long-wave UV light (figure 7, left). This can reveal the location of the filler in emeralds, especially in stones that are mounted in jewelry and cannot be fully viewed in the microscope.
One of the most common inclusions in corundum, an aluminum oxide (Al2O3), is rutile silk, a titanium dioxide (TiO2). In natural blue sapphires heated above 1000°C, rutile can start to break down, causing Ti4+ ions to dissolve into the corundum and creating titanium-aluminum vacancies (Hughes and Perkins, 2019). These vacancies have a chalky fluorescence under short-wave UV light, providing evidence of heat treatment (figure 7, right).

GIA gemologists also assign a color to the stone. This call is an overall impression of the stone in the “face-up” position, which can be challenging for colored stones given the differences in cutting styles, the impact of pleochroism, and possible phenomenal optical effects (play-of-color in opal, for instance). To keep calls consistent, all GIA laboratories use color chips from the Munsell Book of Color and a standard light box. Master stones are also used for comparison of specific color calls (figure 8).
The GIA Identification Report may also include color calls that align with certain color designations used in the trade. Corundum has two of these. “Royal blue” is reserved for sapphires with a highly saturated blue color. Rubies with a vivid red color that have low iron content and a strong red fluorescence under long-wave and short-wave UV light are known in the trade as “pigeon’s blood” rubies. Stones with these designations must not be laboratory-grown, treated by a diffusion process, dyed, or assembled.

GIA gemologists select the appropriate analytical instrumentation for each colored stone’s identification, treatment detection, and/or geographic origin determination (table 1). These methods consist of UV-Vis-NIR and FTIR spectroscopy (both presented earlier in the “Diamonds” section), Raman spectroscopy, energy-dispersive X-ray fluorescence (EDXRF) spectroscopy, and laser ablation–inductively coupled plasma–mass spectrometry (LA-ICP-MS).
FTIR data can assist with natural vs. laboratory-grown determinations for alexandrite and emerald and detect certain treatments such as polymer impregnation and heat treatment. Colored stones that routinely undergo FTIR analysis include corundum, chrysoberyl, jade, and quartz (Breeding and Ahline, 2024). GIA gemologists use UV-Vis-NIR data to better understand the cause of a stone’s color (or lack of color). UV-Vis-NIR is routinely applied to sapphire, emerald, tourmaline, and cobalt spinel (Jin et al., 2024).
EDXRF and LA-ICP-MS are used to look at a stone’s elemental makeup. EDXRF offers nondestructive analysis, either qualitative or quantitative, of a stone’s chemical composition. This can aid in the identification of color-enhancing coatings and other treatments, the presence of certain elements indicating a natural or laboratory-grown origin, and geographic origin (Sun et al., 2024). Gems routinely analyzed by EDXRF include turquoise, tourmaline, corundum, and tanzanite.
LA-ICP-MS is a highly sensitive instrument that rapidly and precisely analyzes the quantitative chemical composition of a gem. It is minimally destructive, requiring a very small sample—from a pit roughly 50 μm wide and 50 μm deep (the diameter of a human hair). This pit is not visible without the use of a microscope or gemological loupe. LA-ICP-MS assists with geographic origin determination, the separation of natural and laboratory-grown gems, and detecting certain forms of treatment (Sun et al., 2024). Since LA-ICP-MS is capable of measuring more trace elements with lower detection limits than EDXRF, this data is used extensively for trace element plots when making geographic origin determinations. The sample’s chemistry is compared against samples of known origin to narrow down the list of potential geographic origins (refer to G&G’s Winter 2019 special issue on geographic origin).
Raman spectroscopy is also commonly employed to identify colored stones. Monochromatic light in the form of a laser interacts with a gemstone, creating vibrations in the atomic structure. Some of the laser’s energy is absorbed by the material to produce these vibrations, and photons are re-emitted or scattered from the material with lower energies corresponding to its vibrational modes. The resulting scattered light is plotted in a spectrum that serves as a fingerprint for identifying the gemstone or an inclusion within it (Eaton-Magaña and Breeding, 2016; Jin and Smith, 2024). Note that the incident monochromatic light can also interact with vibrations in the gem and scatter light with higher energy, though this higher-energy scattered light is not routinely used in practice; again, see Jin and Smith (2024). Raman analysis is useful in identifying rough or aggregated material when the surface does not allow clean refractive index readings or when other standard gemological tools do not provide precise data. Many inclusions, once identified, can narrow down the potential geographic origins of a given gemstone species and, in some cases, reveal a natural or laboratory-grown origin. Raman data are collected on the same instrument that measures PL spectra. For colored stones, PL spectroscopy is mostly used for detecting heat treatment in spinel (Saeseaw et al., 2009).
Beyond these techniques, a gemologist’s most valuable tool is the microscope. However, the microscope’s effectiveness depends on the user’s knowledge—not just of the instrument itself, but also in interpreting the information they gather. Each gemologist builds their own “internal database,” obtained through years of studying reference gemstones of known origin and treatment status.
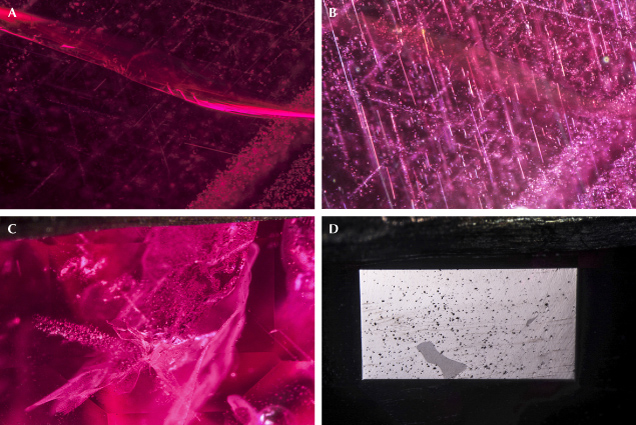
Each GIA laboratory gemologist uses a GIA gemological microscope with 50× magnification. These microscopes are equipped to view a stone’s internal and external characteristics using numerous lighting techniques to highlight different aspects. These techniques include darkfield, brightfield, diffused, reflected, and polarized lighting as well as fiber-optic illumination (figure 9).
Darkfield illumination enters a transparent stone from the sides, making inclusions appear bright against a dark background. Brightfield illumination shows inclusions as dark shapes against a bright background. With transmitted light, the opaque shield is removed to create brightfield light and the microscope stage is covered with a white translucent filter. This is ideal for observing color zoning. Reflected light comes from a light source above the stone and reflects off the surface, allowing easier examination of the stone’s external characteristics. Polarized light is produced by placing a polarizing filter on the stage in brightfield and an analyzer (a second polarizing filter) above the stage in a crossed position. Viewing through these crossed polarizers provides insight into optically aligned and unaligned features in the stone. Fiber-optic light is a pinpoint light source that provides illumination from any angle, making it effective and versatile for examining both loose and mounted gemstones that are transparent to opaque (Renfro, 2015).
In performing their analyses, GIA staff use various light sources to examine the external and internal features of the gemstone, as well as the mounting if necessary. External features include coatings, indications of assemblage, evidence of repair or damage, and surface remnants from heat treatment. Internally, they examine inclusions that support a natural or laboratory-grown origin, evidence of clarity enhancement or dye, and inclusion suites that point to a specific geographic origin.
Once all data is collected and documented, it must be evaluated together. Gemologists in the identification department are trained extensively on more than 60 gemstone species, their varieties, and the treatments associated with each. They develop the skill to accurately and consistently determine the geographic origin of natural corundum, emerald, Paraíba-type tourmaline, red spinel, and alexandrite. This expertise comes from years of training the eye, examining countless samples, and interpreting accurate data.
The foundation of accurate classification is a reliable research collection, especially when determining geographic origin. GIA’s field gemology team has conducted more than 100 field expeditions, collecting samples at mines, trading centers, and international trade shows. These samples undergo extensive analysis by GIA’s research team using all available standard gemological tools and analytical techniques (Vertriest et al., 2019). This data is shared globally with GIA gemologists to enhance their knowledge and proficiency.
PEARLS
The first step in examining pearls is surface observation, followed by various advanced testing techniques (table 2) that reveal growth structures, surface structure, and any sign of treatment such as artificial color concentrations or a worked surface. Pearls can be classified as either whole or blister pearls based on their growth formation. A shell blister may resemble a blister pearl, but they have a different internal structure and can be separated using X-ray imaging techniques (Lawanwong et al., 2019). Since a shell blister is not considered a true pearl, the result issued on an identification report will be the same as for any shell material.

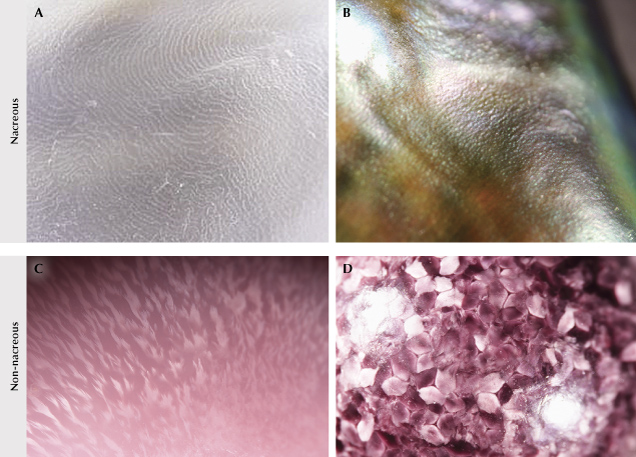
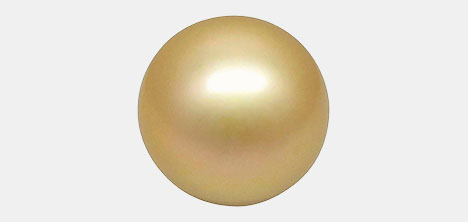
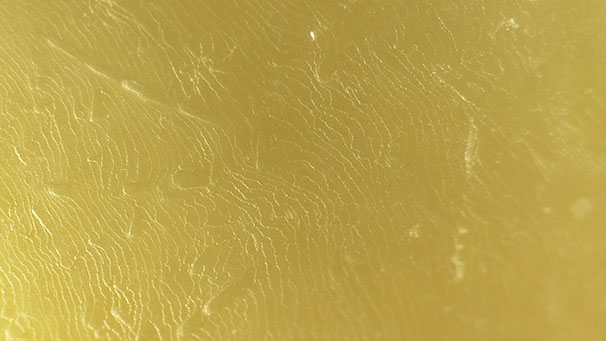
Pearls come from various mollusk species, and the visible differences in surface structure and color are related mainly to their producing mollusks. Pearls can be classified as nacreous or non-nacreous depending on their surface structures. Most commercially available pearls are nacreous, constructed from layers of stacked aragonite tablets. They often resemble a fingerprint when viewed under magnification. Non-nacreous pearls can display a variety of surface structures due to the diversity of mollusk species. Those with a porcelain-like luster and flame structure, such as conch and melo pearls, are referred to as porcelaneous (figure 10) (Hänni, 2010; Zhou and Towbin, 2024).
Digital real-time X-ray microradiography (RTX) is an important technique for analyzing a pearl’s internal structure and determining whether it is natural or cultured, which is further classified into bead cultured or non-bead cultured (Sturman, 2009; Karampelas et al., 2017). Interpretation of the results is based on GIA reference samples collected over many years (Homkrajae et al., 2021; see figure 11). When RTX analysis cannot provide sufficient details for the determination, X-ray computed microtomography (μ-CT) can be used to view the internal structure in greater detail through high-resolution 3D imaging. However, the μ-CT technique works best with loose pearls; those mounted in jewelry must be unmounted and unstrung. Furthermore, metal remnants inside a drill hole may cause artifacts that obscure parts of the pearl’s internal structure (Karampelas et al., 2010; Krzemnicki et al., 2010).

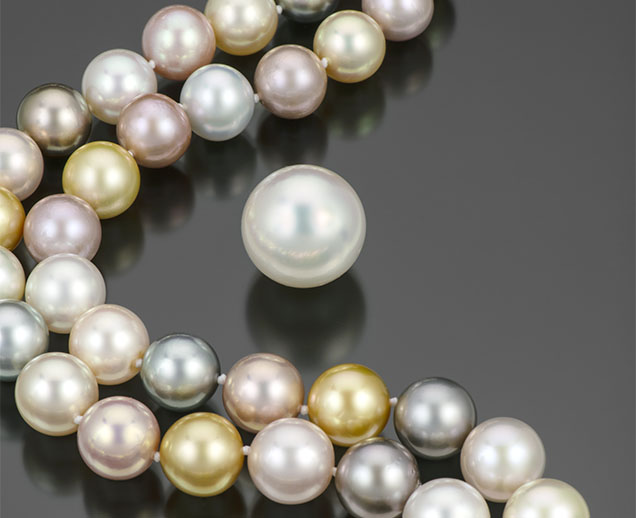
Pearls form in either saltwater or freshwater environments, and identifying the origin environment involves two advanced techniques: EDXRF and X-ray fluorescence (XRF) imaging. EDXRF analysis is particularly useful for detecting the levels of manganese and strontium within a sample. Manganese is generally high in freshwater pearls but very low or even absent in saltwater pearls. Saltwater pearls display higher strontium levels compared to freshwater pearls. LA-ICP-MS may be used to investigate other trace elements when EDXRF and X-ray fluorescence imaging cannot conclusively separate freshwater and saltwater pearls (Sturman et al., 2019; Homkrajae et al., 2019; Sun et al., 2024). Under X-ray fluorescence, most freshwater pearls exhibit moderate to strong greenish yellow fluorescence due to trace amounts of manganese, while saltwater pearls are generally inert (Sturman et al., 2019; Homkrajae et al., 2019). XRF imaging is normally done on multiple pearls in an item such as the pearl necklace shown in figure 12.
Raman photoluminescence spectroscopy is used to identify the calcium carbonate (CaCO3) polymorphs forming the pearls and determine the color origin (Karampelas et al., 2020; Eaton-Magaña et al., 2021). Most pearls available in the market are composed of aragonite. However, some non-nacreous varieties form from calcite, such as scallop pearls (Pectinidae family) and pen pearls (Pinnidae family). UV-Vis-NIR reflectance spectroscopy is another essential technique for color origin determination (Iwahashi and Akamatsu, 1994; Elen, 2001; Karampelas et al., 2011). Some white and lighter-colored pearls have been chemically processed to whiten or brighten their surface appearance. This treatment can be detected using long-wave UV (385 nm) or short-wave UV (275 nm) fluorescence spectroscopy (Zhou et al., 2020; Tsai and Zhou, 2020; Zhou and Towbin, 2024).
CONCLUSIONS
The rigorous testing and analysis conducted by gemological laboratories play a crucial role in ensuring the authenticity and quality of gemstones. Through advanced gemological technologies and expert evaluation, GIA’s laboratory provides accurate assessments of diamonds, colored stones, and pearls that contribute to the integrity of the gemstone market by offering consumers and professionals confidence in their purchases and appraisals. The work done in the laboratory not only reinforces trust but also advances the science of gemology.
For this reason, GIA offers an array of reports for colored stones, pearls, and diamonds intended to protect consumers of fine jewelry and enhance trust in the market for gemstone dealers. The case studies at the end of this article show examples of the grading methodologies used. More details of reports offered by GIA can be found online at www.gia.edu/gem-lab.
As the gem and jewelry industry continues to evolve, so does GIA’s laboratory, adapting to meet the industry’s ever-changing needs. Through continuous research and the use of advanced gemological testing, GIA maintains a high degree of accuracy that defines its grading and identification reports.


