. Right: A powder XRD pattern of a hydrogrossular garnet.")
ABSTRACT
One of the fundamental tasks in a modern gemological laboratory is identifying the species of a gemstone. Laboratories apply many different approaches, from routine methods used for almost every gemstone to more advanced techniques on a case-by-case basis. While standard gemological testing can accurately identify the most common gemstone species, additional testing is often required for unusual or rare stones. Two advanced analytical tools for phase identification are reviewed in this article: Raman spectroscopy and X-ray diffraction. Both methods harness photon scattering to characterize the atomic-scale structures of materials. Raman spectroscopy relies on inelastic light scattering from crystal lattice or molecular vibrations. X-ray diffraction relies on constructive interference of X-rays “reflected” from regularly spaced atomic layers of a crystal lattice. In addition to identifying mineral species, these techniques can capture information about composition, degree of crystallinity, strain, and other factors that affect a material’s structure. The applications of these techniques are summarized first, followed by technical details regarding the underlying physics and instrumentation.
While testing or grading a gemstone, the first and perhaps most critical step is gem identification. Gem species are primarily defined as the mineral species that the gems belong to, which can be further divided into different gem varieties based on colors and phenomena. A mineral species is defined by both its chemical composition and specific crystal structure, which means chemical analysis techniques alone (e.g., X-ray fluorescence, electron probe microanalysis, and mass spectrometry) may be insufficient for a conclusive species identification. Furthermore, light elements such as carbon, beryllium, lithium, and hydrogen may be difficult to detect and analyze using common chemical analysis methods, leading to an uncertain chemical formula for the tested material. Techniques that can characterize the crystal structure of a solid material may therefore be necessary.
For colored stones, gemological laboratories mainly see ruby, sapphire, and emerald—the most popular gemstones. The vast majority of well-known gems can be accurately identified using standard gemological testing, including measurements of refractive index (RI) and specific gravity. Sometimes, however, a laboratory encounters unusual or rare gemstone species that require advanced analytical techniques. One of the most important categories of analytical techniques is spectroscopy, which characterizes how a solid responds to electromagnetic radiation of various wavelengths. Most spectroscopic methods analyze either absorption or emission spectra, which reflect the material’s chemistry and chemical bonding but do not reveal the overall structure. When characterizing the structure of a material, the electromagnetic waves scattered by the material must be analyzed. Scattering is a term used in physics to describe how moving particles (including photons) are deflected from a straight path by localized nonuniformities in the medium through which they pass.
Raman spectroscopy and X-ray diffraction (XRD) are the two methods commonly used for identifying unknown materials based on their crystalline or atomic structures. Both are scattering techniques, but they operate on dramatically different physical principles. The similarities in data presentation and overlapping applications in a gemological laboratory make it useful to discuss and compare the two methods together.
DATA INTERPRETATION OF RAMAN SPECTRA AND X-RAY DIFFRACTOGRAMS
Both Raman spectra and X-ray diffractograms (XRD patterns) are presented as intensity plots. The difference is that a Raman spectrum is plotted against wavenumber (figure 1, top), whereas an XRD pattern is plotted against diffraction angle (figure 1, bottom). Identification using either Raman spectroscopy or XRD involves comparing the band positions, intensities, and shapes of a collected spectrum against those of known materials. This process requires a database containing the reference spectra or diffraction patterns of all possible materials.
The most comprehensive database of powder X-ray diffraction patterns used for phase identification is the Powder Diffraction File (PDF), with more than one million entries. The International Centre for Diffraction Data (ICDD) maintains the PDF, which is accessible through a paid subscription (Kabekkodu et al., 2024). Several free but less comprehensive databases, such as the Crystallography Open Database (COD; Grazulis et al., 2009) or the Cambridge Structure Database (CSD; Groom et al., 2016), are also available for specific fields.
However, there is no comprehensive Raman spectra database for phase identification, due to the impracticality of tracking more than 170 million known chemical substances (a rapidly growing number as new substances are created). Instead, small field-specific databases (such as RRUFF for minerals) are maintained for specialized applications. While manual search-and-match processes can be tedious and time-consuming, modern computer programs make it possible to match experimental data with known spectra in a database within seconds.
The peaks in a Raman spectrum are often broader and more variable, which can make it challenging to match them with reference spectra, especially when peaks from multiple phases are present or the background is high. Software can only provide the user with a constrained list of possible matches, sometimes with a numerical score for the closeness of the match, which leaves the final decision with the user. It is important to keep in mind that band positions, intensities, and shapes can vary as a function of many different factors, including composition, strain, degree of crystallinity, or instrumental parameters such as excitation wavelength or laser polarization relative to the sample. Therefore, human judgment remains essential to a conclusive analysis.
In contrast, the peaks in XRD patterns of crystalline materials are much sharper and better separated. In fact, the peak sharpness of an XRD pattern is limited mainly by the instrument rather than the intrinsic properties of the analyzed sample. Therefore, XRD’s algorithm for phase identification is more straightforward, focusing solely on the positions and relative intensities of a handful of the strongest peaks without considering peak shapes and broadness. This approach is especially advantageous when diffraction data is collected on a mixture of multiple phases, as peaks from individual phases show less overlap. Nonetheless, the exact peak positions and intensities in an XRD pattern are affected by the composition, strain, and ordering states of the structure, again making human judgment necessary for the final decision.
For both methods, the complexity of the spectrum or diffraction pattern tends to decrease with increasing symmetry of the crystal structure. Because Raman scattering is an indirect probe of the crystal structure, calculating the theoretical Raman spectrum of a known structure is a very complicated quantum mechanical computation, the result of which almost never matches experimental data perfectly (e.g., Maschio et al., 2013, 2014). As a result, it is impossible to deduce the crystal structure from a given Raman spectrum, with the exception of some general qualitative speculations. An XRD pattern, on the other hand, is a direct reflection of the crystal structure, allowing straightforward calculation even by hand. In fact, many complicated crystal structures were solved by XRD before the advent of the computer. This direct relationship makes it possible to refine the details in a crystal structure—e.g., lattice parameters, atomic coordinates, occupancies, and displacements—by fine-tuning the parameters and matching the computed pattern to the experimental data. With high-quality diffraction data, it is even possible to solve the crystal structure of a completely new or unknown material.
APPLICATIONS OF RAMAN SPECTROSCOPY AND X-RAY DIFFRACTION IN GEMOLOGY
The applications of Raman and XRD are presented here first, to avoid overwhelming the reader with the technical details of each method. Despite the convoluted physical principles and technical complications, computer programs make their use quite straightforward. However, a deeper understanding of the technical details is often required to correctly interpret the data, which is why we take the opportunity to explain the physical principles and data collection of these techniques toward the end of this article. Raman and XRD largely serve the same function, which is to identify the characteristic structure of a material. Although not all crystalline materials are Raman-active (most gem minerals are), they always diffract X-rays to produce a unique pattern. Conversely, Raman spectroscopy is not limited to crystalline structures: It can also identify bond vibrations in polymers or small molecules in liquid and gaseous materials. XRD cannot identify molecular materials unless they are crystallized.
There have been several review articles and book chapters on applications of Raman spectroscopy to gemology (Kiefert et al., 2001; Bersani and Lottici, 2010; Fritsch et al., 2012; Eaton-Magaña et al., 2021), though almost no publications mention XRD in a gem laboratory. Nonetheless, to avoid repeating previous works, this article will broadly summarize how Raman and XRD assist in testing gem materials. Readers should refer to the referenced articles for the details in each specific application. Given that XRD is less commonly used in a gemological laboratory, Raman spectroscopy will be emphasized.
Gem Species Identification. Gem species identification is obviously the most basic application of Raman spectroscopy and XRD. Both Raman spectra and XRD patterns serve as signatures or fingerprints of specific material species. As explained earlier, identification of a gem species requires comparing the experimental data with spectra of known materials in a database. While there is a comprehensive XRD database for crystalline materials, it is excessive for gem identification purposes. The most commonly used option in a gemological laboratory is the XRD data of minerals in the RRUFF project (Lafuente et al., 2015). When Raman or XRD is needed to confirm a gemstone’s identity in a laboratory, it always follows other tests, such as chemical analyses, that have already narrowed down the possibilities.
BOX A: PORTABLE RAMAN SPECTROMETERS
Raman spectroscopy offers a fast, simple, and nondestructive means of identifying phases of molecular or crystalline materials, making it valuable across a wide range of scientific and industrial applications. These include pharmaceuticals, narcotics, biopsy, nanotechnology, chemical engineering, material design, explosives detection, and the study of art and cultural heritage artifacts. Its versatility has led nearly all spectrometer manufacturers to offer portable, general-purpose Raman devices that range in size from a smartphone to a small briefcase.
As illustrated in figure 5, the basic configuration of a Raman spectrometer is quite simple, consisting of a laser source, a spectrometer, and optics to direct the laser and scattered light. This simplicity enables the design of compact Raman spectrometers. In fact, the display and controls are often the size-limiting components for a fully integrated, stand-alone instrument with its own system (Crocombe et al., 2023). Compared to a research-grade Raman spectrometer, these portable devices are equipped with much weaker single-laser sources and much lower-resolution spectrometers. The optics are also much simpler, directing the laser and collecting the scattered light from a much larger area on the sample. Nonetheless, they offer the benefits of affordability, convenience, and fewer safety restrictions, making Raman spectroscopy accessible to less-experienced users.

Although a few devices on the market are specifically designed for gemological use, there are some significant limitations the buyer needs to be aware of before applying them to gem identification. Not all gemstones exhibit Raman spectra with sharp, distinct peaks; some may show broad overlapping bands instead (figure A-1, A–D). Some gemstones are weak Raman scatterers that require intense laser power or long exposure time to acquire usable data. Some gem materials have strong fluorescence, which can saturate the detector and overwhelm Raman signals, requiring lasers of longer wavelength to reduce the photoluminescence (figure A-1, E and F). No single laser wavelength or power is suitable for all materials, so research-grade Raman spectrometers are equipped with multiple laser sources and adjustable power output. A portable Raman device, on the other hand, is only equipped with a single weaker laser source (usually a green laser for gemological applications), which could significantly limit its use on challenging gem materials with a weak Raman signal or strong fluorescence.
Moreover, phase identification using Raman spectroscopy requires comparing the collected data with a reference database, but this is not always straightforward or conclusive. Gem materials encompass a wide range of drastically different materials, including natural and synthetic single crystals, polycrystalline rocks, organic or composite materials, and even amorphous materials such as plastic and glass. There is still no comprehensive Raman database for quick and accurate gem species identification. The best available option is the Raman spectra data of minerals from the RRUFF project (Lafuente et al., 2015). However, most minerals are not gemstones, which means this database contains many irrelevant references that could slow down the identification rate or lead to errors. Most Raman devices designed for gem identification come with custom-built databases, but their completeness and accuracy for challenging or obscure gem materials are difficult to assess.
Raman spectroscopy is generally more effective and efficient when the range of potential matches is limited, minimizing the chance of misidentification. This is why portable Raman devices excel at quickly detecting explosives or toxic substances. Despite some advertising claims that these portable devices can instantly identify a gemstone species with 100% accuracy, a Raman spectrometer is not a stand-alone gem identification method—it should be used as confirmation after standard gemological tests have eliminated all but a few possibilities. It is best suited for identifications within subcategories of gem materials where the possibility pool is limited, such as a trader or appraiser who exclusively deals with diamond and diamond simulants or a ruby miner who wants to quickly separate garnet from corundum. It should be noted that these specialized applications may require a custom database for the device to be most efficient.
CHECKLIST FOR PURCHASING A PORTABLE RAMAN DEVICE
Self-Assessment
• What is my primary need for this equipment?
• Is this equipment best for my particular applications?
• Can I justify the cost based on the additional information I can expect from this equipment?
Questions for the Manufacturer
• What is the laser wavelength and power?
• What is the laser safety classification, and does it meet local regulations or require special training to operate safely?
• What is the expected learning curve to operate this equipment?
• What support does the manufacturer offer users?
• What warranty is provided?
• Is there dedicated software specific to gemology?
• How often is the software updated?
• How many gemstones are included in the software database?
• Is the database customizable for special applications?
Given that a Raman spectrum can be collected on a faceted crystal very quickly (within seconds, depending on the instrument), it is routinely used for rapid gem species identification, especially when a fast turnaround is required. Small portable Raman spectrometers (box A) are also useful as a simple way to confirm the identity of gemstones when other testing methods are not easily accessible. Furthermore, a Raman spectrometer would undoubtedly be an important component of any automated system designed to sort large quantities of small gemstones.
Raman spectroscopy is ideally suited for common gem species such as corundum, beryl, chrysoberyl, feldspar, tourmaline, spinel, and garnet (Jenkins and Larsen, 2004). While XRD is always more reliable for identifying gem or mineral species, it is often considered a destructive analytical method in which samples are crushed into a fine powder. However, modern area detectors using Debye-Scherrer diffractometers have made it possible to collect powder XRD patterns directly from single crystals such as faceted gemstones with pointed culets using a Gandolfi stage (Gandolfi, 1967; Schmidt, 2019). Cabochon-cut aggregate gemstones made up of many small crystals (e.g., jadeite, nephrite, chalcedony, turquoise, and hydrogrossular) can also be directly analyzed by XRD in either the Bragg-Brentano or Debye-Scherrer geometry with the appropriate sample stage (see the “X-Ray Instrumentation and Data Collection” section below). While Raman is much more efficient and user-friendly, XRD is occasionally used in the gemological laboratory when Raman spectroscopy together with chemical analysis cannot conclusively identify an obscure specimen. For instance, the recently discovered mineral johnkoivulaite was identified in GIA’s laboratory when its Raman spectrum and XRD pattern did not match any known mineral species (Palke et al., 2021). Characterizing the crystal structure using XRD (either single-crystal or powder diffraction) is often a prerequisite for proposing a new mineral species to the International Mineralogical Association (IMA) (Nickel and Grice, 1998).
The subtle differences in peak positions and shapes in Raman spectra and XRD patterns reflect variations in the crystal structures of the tested material, providing additional structural information beyond phase identification. For instance, Raman spectroscopy can separate beryl into different groups based on alkali content, and it can identify molecule species such as carbon dioxide and water in structural channels. This information aids in determining geographic origin or distinguishing natural from synthetic emerald (Łodziński et al., 2005; Huong et al., 2010). The ordering state of spinel is reflected in its Raman spectrum (and XRD pattern), assisting in heat treatment detection. Peak positions in the Raman spectrum have even been proposed as a means to calculate the chemical composition of a garnet (Bersani et al., 2009), though the results are too inaccurate for practical applications.
Raman and XRD can also be applied to certain amorphous materials. Without the long-range ordering of a well-defined crystal structure, amorphous materials do not show sharp peaks in their Raman spectra or X-ray diffraction patterns but display broad bands determined by short-range local structures. The various categories of opal (opal-A, opal-CT, and opal-C), which can also be distinguished to some extent by Raman spectroscopy (Smallwood et al., 1997; Ilieva et al., 2007; Sodo et al., 2016), are defined by their distinct XRD patterns showing bands with various positions and sharpness (Jones and Segnit, 1975). The C-C, C-O, or C-H bonds in some polymeric chains of purely organic gems such as amber and copal can also be identified and characterized by Raman spectroscopy (Verkhovskaia and Prokopenko, 2020; Karolina et al., 2022).
Inclusion Identification. While most gemstones submitted to a gemological laboratory are valued for their high clarity and lack of inclusions, these tiny trapped materials can provide crucial insights into the geological and treatment history of a gemstone. Therefore, identifying and characterizing inclusions is sometimes a critical test in gemological analysis. The confocal mode in a Raman microscope makes it possible to analyze inclusions measuring only a few micrometers.
Primary inclusions reflect the geological conditions in which gemstones were formed, with certain mineral inclusions or inclusion combinations serving as characteristic fingerprints for a specific locality. Inclusion identification using Raman spectroscopy has emerged as a valuable tool in determining the geographic origin of corundum (Dele et al., 1997; Garnier et al., 2008; Graham et al., 2008; Palanza et al., 2008; Xu and Krzemnicki, 2021). This technique can also identify the liquid and gas species trapped inside fluid inclusions in gemstones. In practice, however, origin determination using inclusions relies largely on their visual appearance, without the need for Raman spectroscopy (Palke et al., 2019a,b).
Characterizing certain mineral inclusions may also help detect treatment processes. For instance, goethite and diaspore dehydrate at low temperatures (<600°C), so identifying them proves the host corundum has not been subjected to heat treatment (Krzemnicki et al., 2023). Other inclusions, such as zircon in corundum, may decompose or melt when heated at high temperatures, and thus their decomposition product (baddeleyite in the case of zircon) indicates high-temperature heat treatment (Rankin and Edwards, 2003; Wang et al., 2006). Radiation-damaged zircons can recrystallize during annealing at relatively low temperatures (Zhang et al., 2000a,b; Ende et al., 2021), which means characterizing the peak sharpening and positional shift of zircon inclusions in corundum may help detect low-temperature heat treatment as well.
Inclusions in diamonds are scientifically valuable, as these often fully enclosed materials contain information from deep inside the earth that would be impossible to obtain otherwise. Raman spectroscopy and XRD are the primary methods for studying these samples in geological research (Angel et al., 2022; Smith et al., 2022). The recently discovered mineral crowningshieldite was identified and characterized as an inclusion in a type IIa diamond using both methods (Smith et al., 2021). Although inclusion identification may help separate natural gemstones from synthetics, inclusions do not routinely undergo Raman spectroscopy, since other testing methods are more effective at achieving the same goal.
Testing Pearls and Other Biogenic Carbonate Gems. Biogenic gems are discussed separately because they often contain composite materials rather than a single mineral. Pearls (and shells) are composed mainly of biomineralized calcium carbonate in organic matrices. Calcium carbonate has three known polymorphs (minerals with the same chemical formula but different crystal structures)—aragonite, calcite, and vaterite (figure 2)—and all three can be found in pearls. More than one polymorph (and sometimes all three) can be found in pearls from the same species, or even within the same sample.

Most pearls, both nacreous and non-nacreous, are made up mostly of aragonite. Calcite frequently occurs in low-quality nacreous pearls accompanying aragonite, and it is the main component of some non-nacreous pearls produced by a few special mollusk species. Vaterite, an unstable polymorph of calcium carbonate, does not occur regularly in pearls but has been reported in certain growth zones or sectors of freshwater cultured pearls (Qiao et al., 2007; Wehrmeister et al., 2007; Soldati et al., 2008). The factors that determine the carbonate species found in a given pearl are not fully understood, but the mollusk species and the environment (temperature and chemistry) undoubtedly play crucial roles. Therefore, identifying the calcium carbonate polymorph is an important test for determining the mollusk species and origin of certain pearl types (Eaton-Magaña et al., 2021). The same test applies to corals, which may comprise aragonite, calcite, or almost purely organic matter depending on the type. One notable example (Karampelas et al., 2009) is separating the endangered and internationally protected Stylaster corals (aragonite with carotenoid pigment) from the highly valued red coral from the Corallium genus (calcite with parrodiene pigment).
Besides identifying the specific carbonate polymorph, Raman spectroscopy and XRD can also reveal information about the chemistry, which may also help in separating pearls from different species or environments. The exact position of the calcite Raman peak at ~710 cm–1 is sensitive to magnesium content (Kim et al., 2021). Disordered dolomite (calcite with almost half of the calcium substituted by magnesium) was recently discovered in the center of a natural Cassis pearl using Raman spectroscopy and XRD (Zhou et al., 2023).
One complication in pearl analysis is the orientation effect. Unlike faceted single-crystal gemstones with sharp points, which can either be tested on different facets or randomized using a Gandolfi stage, the surface of a nacreous pearl is always perpendicular to the c-axis of the aragonite due to the orderly packing of platelets in the nacre (Yoshimi et al., 2004). A similar orientation can be observed in some calcite pearls (Okumura et al., 2010; Pérez-Huerta et al., 2014). The restricted orientation may result in spectra or diffraction patterns that differ significantly from the reference, in which the peak positions remain the same but the relative intensities of the peaks are different due to the biased orientation during analysis (e.g., Friedmann, 1957; Yoshimi et al., 2004; Lu, 2009; Gao et al., 2023). This orientation effect does not affect qualitative phase identification, especially when the possibilities are limited to carbonates, but quantification may be impossible without destructive testing, which is only applied for research purposes.
Treatment Identification. Besides identifying altered (or unaltered) natural inclusions, Raman spectroscopy can help identify foreign materials introduced during treatment. Since materials introduced by treatment are often highly localized and amorphous, the applications discussed in this section mostly pertain to Raman spectroscopy and do not apply to XRD.
One common clarity enhancement for colored stones and diamonds is the filling of fractures using RI-matching materials such as glass or epoxy. Raman spectroscopy can detect the lead glass fillers in fracture-filled rubies and the flux in fracture-healed rubies (McClure et al., 2006; Calvo del Castillo et al., 2009; Fan et al., 2009). The organic materials used to fill gems of lower RI, such as jadeite and emerald, can also be identified by their various Raman-active C-C, C-O, and C-H bonds (Johnson et al., 1999; Kiefert et al., 1999, 2000). This test is especially useful for emeralds, as the acceptability of a permanent filler (epoxy) versus a removable filler (oil) may vary depending on customer preference.
Coating of faceted surfaces is another treatment sometimes used for luster enhancement, color alteration, or protection from scratches. Certain coating materials, such as diamond films, are also easily identified by Raman spectroscopy (Fritsch et al., 1989). Notably, Raman spectroscopy is only applicable when a significant amount of a new phase is introduced by the treatment. The claim suggesting that beryllium diffusion (or any diffusion treatment) can be detected by Raman (Sastry et al., 2009) contradicts the basic principle of Raman scattering and is completely unsupported by any empirical evidence.
Raman spectroscopy can also help distinguish natural-color pearls and corals from color-treated or dyed material. Many natural-color pearls and corals derive their color from polyenic pigments (Karampelas et al., 2007). If a pearl or coral displays a color known to be from a polyenic pigment in nature but does not show any polyenic peaks in its Raman spectrum, the color must be the result of treatment. Certain dyes used to enhance the color of pearls, such as silver nitrate for blackening freshwater pearls, show distinct peaks in their Raman spectra, making identification even simpler.
PRINCIPLES OF RAMAN SCATTERING
Scattering of visible light occurs everywhere in the world around us. Thin clouds and snow appear white because of the non-selective scattering of the visible spectrum by water droplets or ice flakes. Scattering is almost always elastic, meaning the light’s wavelengths remain unchanged. Imagine a bright green spot that appears from shining a green laser pointer at the wall. The wavelength and color of the bright spot are exactly the same as the laser beam because almost all the light is scattered elastically. However, if our eyes were supersensitive detectors of both intensity and wavelength, we would see that the bright spot on the wall actually contains tiny amounts of light of different colors (wavelengths). Some of this inelastic scattering of light, about 10 million times weaker than elastic scattering (Pasteris and Beyssac, 2020), is called Raman scattering, named after Sir C.V. Raman, the Indian physicist who received the Nobel Prize in 1930 for recognizing it. The spectrum of Raman-scattered light contains information from the light-scattering medium, which can be used to identify and characterize materials.


Most introductions to Raman spectroscopy focus on inelastic scattering by molecules, in the manner of its original discovery (Raman, 1922). In the context of gemology, however, we need to consider inelastic scattering from solids, often crystalline. In this case, Raman scattering also occurs as incoming photons exchange energy with the entire crystal structure. For example, if an incident photon excites a particular crystal lattice vibration, it will lose some specific amount of energy, resulting in a scattered photon of longer wavelength (lower energy) (figure 3). This process is known as Stokes Raman scattering. The amount of energy lost is called the Raman shift, as illustrated in the energy level diagram in figure 4, and it is characteristic for the scattering material. The reverse process, called anti-Stokes Raman scattering, where photons gain specific amounts of energy from the vibrating lattice, can also occur but tends to be weaker and harder to detect. Therefore, Raman spectroscopy typically focuses on Stokes Raman scattering.
Figures 3 and 4 depict just one Raman shift, but materials usually have multiple available vibrational modes with different energies that can inelastically scatter photons, depending on the bonding structure and symmetry. The spectrum of Raman-scattered light can therefore exhibit bands or peaks at various energies, together providing structural (and to some extent chemical) information. It is often possible to identify and characterize a material based on its Raman spectrum. However, some materials, such as metals and table salt, are Raman-inactive because they cannot scatter light inelastically due to symmetry constraints. Raman spectroscopy is often considered complementary to infrared absorption (IR) spectroscopy, as they both involve observations of vibrational energy states (figure 4), although they often do not activate the same vibration modes.
A key feature of Raman spectroscopy is that it detects small “shifts” in the light energy between the excitation and scattered radiation. For any given Raman-active feature (mode), the wavelength of the scattered light depends on the wavelength of the incident light (e.g., the laser wavelength). This differs from methods such as IR spectroscopy or luminescence spectroscopy, where we associate particular wavelengths of light with particular molecules or defects. This is why Raman spectra are plotted on a wavenumber-shift scale (in units of cm–1) instead of a wavelength scale, as wavelength values are inversely proportional to the photon energies and thus cannot be directly added or subtracted. Note that the units used in Raman and IR spectroscopy, which are both conventionally plotted in wavenumbers (in units of cm–1), are not equivalent. In Raman spectroscopy, a spectrum shows the relative energy, plotted as the Raman shift compared to the laser excitation, which sits at 0 cm–1. In IR spectroscopy, a spectrum shows the absolute energy in wavenumbers.
RAMAN SPECTROSCOPY INSTRUMENTATION AND DATA COLLECTION
There are many different instrument designs and variations on the technique, serving different purposes, ranging from small handheld devices that can fit in a pocket (box A) to large research-grade instruments equipped with multiple laser sources and powerful optical microscopes that take up an entire desk. Regardless of the size or application, the basic configuration of a Raman spectrometer is always the same (figure 5): a laser source to provide intense incident monochromatic light (light of a single wavelength), optics to direct and collect light to and from the sample of interest, and a spectrometer to measure the Raman-scattered light. This section focuses on the more powerful and versatile research-grade instruments that best represent the technical capabilities of Raman spectroscopy.

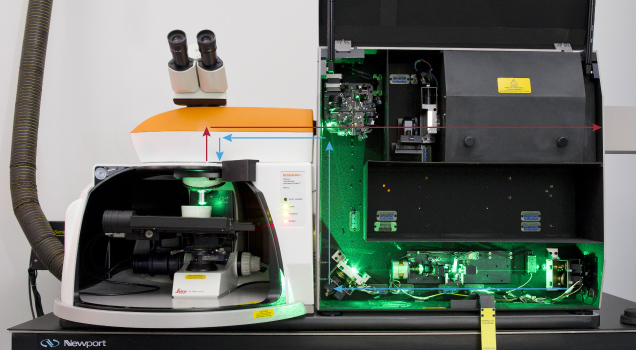
Figure 6 shows an example of a Raman microscope, with the doors opened to reveal the green glow of scattered light from the 514.5 nm laser source. The user views the specimen through the microscope eyepieces or uses a digital camera, bringing the desired point of analysis into focus and moving it under the crosshairs to center it in the focal point of the laser, which is aligned to be coaxial with the objective lens. The same instrument can also be used for photoluminescence spectroscopy (to measure the emission light, as in figure 4). In this case, the recorded spectrum is simply plotted in wavelength (in nanometers) instead of being expressed as a Raman shift (Eaton-Magaña and Breeding, 2016).
Modern Raman spectroscopy owes its success as a practical analytical technique to the development of powerful monochromatic laser sources and sensitive detectors. One important refinement is the use of confocal optics, which blocks out-of-focus light and improves the spatial resolution of the analyzed volume (e.g., Everall, 2009). Confocality is achieved by focusing the collected light through a pinhole or a slit using a more adjustable quasi-confocal arrangement. The spatial resolution also depends on the numerical aperture (NA) of the microscope objective lens and the laser wavelength (λ) and is proportional to λ/NA.
With confocal optics, it is possible to characterize relatively small regions of a gem, such as internal inclusions. For example, a 100× objective lens with a 0.9 NA used in combination with a 514.5 nm laser can achieve a spatial resolution of approximately 1 × 1 × 5 μm3, elongated along the optical axis (i.e., the direction of the incident laser beam). Note, however, that there are many additional factors affecting the spatial resolution (e.g., Kim et al., 2020). Focusing the laser inside a crystal to examine inclusions or other internal features will further distort the light and affect the spatial resolution. Conventional microscope lenses have short working distances, which can become a limiting factor when attempting to analyze inclusions inside a gemstone or when more clearance is needed to work around a jewelry setting. Lenses with a long working distance offer a practical solution, but the tradeoff is a lower NA, which means the light is not as tightly focused and the analyzed volume is larger.
Another important consideration is the choice of laser wavelength. Raman spectrometers are sometimes equipped with multiple interchangeable lasers. A shorter wavelength (e.g., blue 488 nm laser) generally leads to more intense Raman scattering and a slightly smaller spot size. However, it also increases the likelihood of luminescence from the gemstone or other target material. Luminescence (particularly fluorescence) is problematic because it can drown out the Raman signal and decrease spectral resolution (e.g., figure A-1E). For this reason, longer wavelengths such as red (e.g., 633 nm) or even infrared lasers (e.g., 830 or 1064 nm) can be a more practical choice for Raman spectroscopy because they are less likely to excite luminescence. A green laser (e.g., 514 or 532 nm) can offer a good compromise (again, see figure 6). Ultimately, the problem of luminescence depends on the sample and atomic scale defects within it.
Laser power is another variable to consider. Benchtop Raman microscopes often employ lasers in the range of a few to hundreds of milliwatts. Ideally, the laser power that actually reaches the sample after passing through the various internal components can be measured with a laser power meter. Although higher power generally yields a stronger Raman signal, it also increases the risk of altering the sample and obtaining poor-quality data. An intense laser focused down to a spot can produce enough heat to damage sensitive materials, especially if they are dark or opaque. When attempting to collect a Raman spectrum from magnetite (Fe3O4), localized heating from the beam often alters the specimen at the small surface region where the laser is focused, resulting in a spectrum that corresponds to hematite (de Faria et al., 1997). In such cases, the solution is to use a lower laser power, and many instruments allow the option to step down the laser power. Starting at a low laser power and gradually increasing it until obtaining an acceptable Raman signal is a good approach.
Figure 5 shows Raman analysis at a single point. With computer-controlled motorized stages, moving optics, and faster detectors, an increasing number of instruments can collect data from multiple points in succession to achieve two-dimensional and three-dimensional Raman maps. Mapping can be very helpful in rapidly visualizing or imaging heterogeneities that might otherwise be invisible (Eaton-Magaña et al., 2021). As technology continues to advance, Raman spectroscopy will become an even more powerful technique whose applications will continue to expand.
PRINCIPLES OF X-RAY DIFFRACTION
Diffraction is the phenomenon in which a wave is redirected around an obstacle or aperture. While very similar to scattering, diffraction differs in that it applies to waves instead of particles. Since photons demonstrate wave-particle duality, the same physical process involving electromagnetic waves can often be described as both scattering and diffraction. As a wave phenomenon, diffraction does not change the energy or wavelength (being elastic by default) and is often accompanied by interference, especially when the diffracting obstacle or aperture has a periodic structure. The amplitude (or intensity) of the diffracted wave can be recorded by a detector positioned far from the diffracting object (with the detector distance much larger than the size of the diffracting object). This far-field distribution of the diffracted wave amplitude, often expressed in terms of diffraction angle, is known as a diffraction pattern. Diffraction is encountered in everyday life, with the most noticeable examples involving visible light. The striking iridescent colors of butterfly wings and iris agates are examples of naturally occurring diffraction phenomena.
A diffraction grating is an optical grating with a periodic structure that bends light into different directions. The light rays scattered by different slits or grooves in a diffraction grating with a periodicity of d will constructively interfere with each other when the optical path differences between them are integer n multiples of the wavelength (λ):

in which θi represents the incident angle and θd the diffraction angle relative to the grating plane (figure 7, top). The diffraction angle is dependent on the wavelength of the incident light, which means incident light containing a range of different wavelengths can be dispersed by a diffraction grating into a spectrum (figure 7, bottom). This principle is the basis for how most optical spectrometers, such as the one used in Raman spectroscopy, separate light of different wavelengths (again, see figure 5).

For a diffraction grating to effectively bend and disperse the incident light, its periodicity must be larger than, and on the same scale as, the wavelengths of the incident light. For instance, a diffraction grating that effectively disperses the visible spectrum (~400–700 nm; figure 7) typically has a period of a few micrometers. In contrast, a diffraction grating with a nanometer-scale periodicity (i.e., a crystal structure) can only bend electromagnetic waves of shorter wavelengths, which are X-rays. Equation 1 above is known as the first Laue equation in X-ray crystallography (Hammond, 2015), named after Max von Laue (Friedrich et al., 1913). Because crystals are three-dimensional periodic structures, three Laue equations in three different directions must be satisfied simultaneously for diffraction to occur. The three combined Laue equations can be simplified into the more commonly known Bragg’s law (Bragg and Bragg, 1913):

in which the dhkl represents the spacing between lattice planes with a Miller index of hkl.
 compared to the first layer. X-rays “reflected” by different layers (lattice planes) will constructively interfere when the optical path differences equal integer n multiples of the wavelength (i.e., nλ). Bottom: Bragg’s law may be satisfied in more than one way, allowing the X-ray to be diffracted in several directions simultaneously. However, the only experimentally measurable angle is between the diffracted beam and the incident beam, which is 2θ rather than θ.")
Bragg’s law can be intuitively explained as a calculation of the optical path difference between X-rays “reflected” by different layers of lattice planes that are integer multiples of the wavelength, allowing constructive interference (figure 8, top). However, this is a simplification, because the lattice planes cannot truly “reflect” X-rays like a mirror—they are not real physical planes but imaginary ones in the crystal structure. The experimentally measurable angle is 2θ between the incident beam and the diffracted beam, instead of θ relative to the lattice plane (figure 8, bottom). Moreover, Bragg’s law can be satisfied in multiple ways at once, which means the incident X-ray beam can be diffracted into multiple directions in three dimensions by a single crystal. Bragg’s law determines the diffraction angles but does not reveal anything about the intensities of the diffraction peaks. A two-dimensional XRD pattern, known as a diffractogram, combines peak positions (diffraction angles) and peak intensities (figure 1, bottom). Peak positions are determined by the unit cell geometry (lattice parameters). Peak intensities depend on the detailed atomic arrangement within the unit cell.
A crystal structure diffracts not only X-rays but also any form of wave with similar wavelengths as X-rays. Physical particles such as electrons and neutrons can also behave like waves. Known as matter waves or de Broglie waves, they are also commonly used to analyze crystal structures through diffraction.
XRD is not typically considered a spectroscopic method, since a spectrum requires a range of continuously varying wavelengths (or frequencies). Technically, though, its principle is closely related to spectroscopic methods. If the angle θ in Bragg’s law is fixed (equation 2) but the wavelength λ is variable, the X-ray diffraction pattern would indeed become a spectrum. In practice, it is much easier to generate monochromatic X-rays and measure the diffraction angle than to resolve the energy of the diffracted X-rays from a white incident X-ray beam. In fact, the most accurate way to resolve an X-ray spectrum is by using a perfect crystal with known lattice parameters as a diffraction grating to disperse the different wavelengths. In other words, an X-ray diffractometer is essentially an X-ray spectrometer in which the diffraction grating itself is the test subject.
X-RAY INSTRUMENTATION AND DATA COLLECTION
A single small crystal diffracts X-rays in three-dimensional space. This diffraction can be fully characterized using a single-crystal X-ray diffractometer to study the crystal structure in 3D space. However, without any modifications, XRD is assumed to be powder X-ray diffraction, the most widely used diffraction technique. The powder XRD pattern comprises diffracted X-rays from millions of randomly oriented crystal grains. In this process, the orientational information is completely omitted and only the intensity as a function of diffraction angle remains. The most common X-ray diffractometer uses the Bragg-Brentano geometry (figure 9A), in which the powdered sample is spread on a plate as a flat surface. A point or line detector on a moving goniometer arm measures the intensity over a range of diffraction angles. The X-ray source moves on a separate goniometer arm to keep the incident angle to the sample surface the same as the diffraction angle. In some instruments, the X-ray source is stationary but the sample plate rotates along with the detector arm at a θ/2θ relation to maintain the same “mirror reflection” geometry. The Bragg-Brentano geometry optimizes the efficiency and accuracy of a line detector by allowing the diffracted X-ray to be focused on the detector circle.
 rotates together with the detector to maintain a “reflective” geometry that optimizes detection efficiency. B: The Debye-Scherrer diffractometer uses a stationary X-ray source and an area detector or X-ray film. Either a section or the entire diffraction pattern can be collected without moving the detector. The powdered sample is in the center. A smaller amount of sample is required, and it is often rotated during data collection to best randomize the orientation. C: An example XRD pattern of grossular garnet collected on X-ray film using a Debye-Scherrer camera, as illustrated in B. Similar 2D diffraction patterns collected on digital area detectors can be converted to the 1D intensity vs. 2θ plot, as shown in figure 1B.")
However, XRD is not a symmetrical process (figure 8, bottom), contrary to what the Bragg-Brentano geometry suggests (figure 9A). The Debye-Scherrer geometry provides a more complete picture of the diffraction process. Instead of using a point or line detector, it employs an area detector or X-ray film to measure diffracted X-rays in all directions simultaneously, without moving the detector. The sample is often placed in a capillary made of polymers or glass that do not diffract or fluoresce X-rays. The X-ray diffracted by the sample forms concentric cones with half-angles of 2θ as defined by Bragg’s law.
XRD typically employs an X-ray tube as the X-ray source. In this tube, high-energy electrons (accelerated by high voltage) strike an anode material, typically copper or molybdenum, causing it to emit characteristic X-rays. This is essentially the same mechanism Wilhelm Conrad Roentgen used in 1895 to discover X-ray radiation. A rotating anode source, where the anode can be cooled more easily, can produce more intense X-rays, such as those used for medical imaging. A substantially more powerful source, known as a synchrotron, uses a cyclic particle accelerator. High-energy electrons are bent by a magnetic field, emitting electromagnetic radiation of various wavelengths, including X-rays.

With more powerful X-ray sources and more sensitive area detectors becoming increasingly accessible, Debye-Scherrer diffractometers are gaining popularity due to their versatility. Data collection is much faster since the entire diffraction pattern is collected simultaneously, without having to wait for the detector to sweep the necessary angles. Additionally, much smaller sample amounts are required. With a rotating Gandolfi stage (figure 10), even a single crystal grain can be used to generate a simulated powder diffraction pattern by randomizing its orientation in three dimensions (Gandolfi, 1967; Schmidt, 2019). The angular resolution and precision of the Bragg-Brentano geometry are generally better due to the well-focused X-ray beam. However, other factors such as detector distance, beam convergence, and bandwidth are more critical in determining the accuracy of the XRD data.
CONCLUSIONS
Raman spectroscopy and X-ray diffraction are perhaps the most overlooked methods in a gemological laboratory, since they are not always part of routine testing procedures. In many cases, the information they provide is already known or can be acquired through other methods such as standard gemological testing, infrared absorption, photoluminescence, or chemical analysis. However, these phase identification methods become a necessity when testing an obscure gem sample that cannot be conclusively identified by other means. While these materials may only represent a fraction of samples submitted, they are often the ones that require a positive test result. Most gem laboratories can detect diffusion treatment of corundum or identify the origin of an emerald, but recognizing a new mineral species previously unknown to geologists requires additional expertise. The ability to accurately identify atypical or uncommon gem materials is what truly differentiates gemological laboratories by their technical capabilities and depth of knowledge.


