A New Find of Danburite in the Luc Yen Mining Area, Vietnam
ABSTRACT
In the summer of 2015, gem-quality danburite was found in an eluvial deposit of ruby, sapphire, spinel, and tourmaline at the foot of the marble mountains of An Phu in the Luc Yen area of Vietnam’s Yen Bai Province. This danburite is notable for its honey yellow color and excellent transparency. For the present study, rough and cut samples were investigated by standard gemological methods, photoluminescence, spectroscopic analysis (Raman, FTIR, and UV-Vis-NIR), electron microprobe, and femtosecond LA-ICP-MS chemical analysis. Microscopic observations revealed fingerprints and two-phase inclusions (gas/liquid). Additionally, growth zoning was visible with different blue intensities under a long-wave UV lamp. The samples were characterized by high concentration of lanthanides (totaling about 1116 ppm on average) together with the presence of other elements such as Al, Sr, Y, Hf, Pb, and Th, while the concentrations of transition metals were below detection limits. All Raman, UV-Vis-NIR, and photoluminescence results revealed the bands related to rare earth elements. FTIR spectroscopy showed the presence of hydroxyl in the danburite structure.
INTRODUCTION
Danburite, with an ideal formula of CaB2Si2O8, crystallizes in the orthorhombic system. It has a structure composed of a framework of corner-sharing Si2O7 linked with B2O7 groups by eight-coordinated Ca atoms. First discovered in Danbury, Connecticut (United States), gem-quality danburite has also been found in Japan, Madagascar, Mexico, Myanmar, Russia, Sri Lanka, Switzerland, and Tanzania (Hurwit, 1986; Chadwick and Laurs, 2008; Hintze, 2010). Danburite is an exceptionally rare gemstone, however.
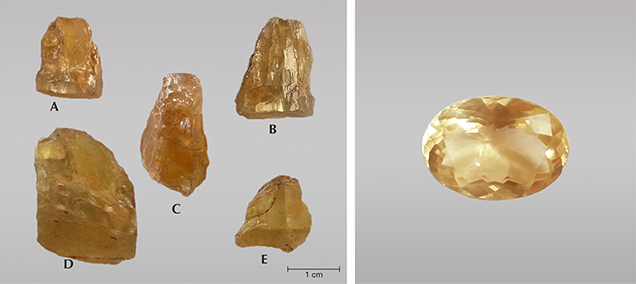
In the summer of 2015, during a geological and mineralogical investigation of a metamorphosed carbonate formation in the Luc Yen district of Yen Bai Province, northern Vietnam, the authors found gem-quality danburite crystals. At the beginning of the investigation, several crystals with sizes up to 2.5 cm (figure 1, left) were found in mining dumps from Bai Cat, an active placer deposit of ruby, sapphire, spinel, and tourmaline located in the An Phu commune. Our team pursued this finding and found many small (1–2 cm) danburite crystals of similar color and transparency along the streams within 2 km of the Bai Cat deposit. One of the rough crystals (figure 1, sample C) was cut into a clean 4.6 ct gem with no eye-visible flaws (figure 1, right). The present article provides a detailed characterization of the newly found danburite from Luc Yen.
GEOLOGIC BACKGROUND
The geology of the Luc Yen mining area has been described by Garnier et al. (2005), Long et al. (2013), and Chauviré et al. (2015). It is dominated by metamorphic rocks, mainly granulitic gneisses, mica schist, and marble, which are sometimes intruded by granitic and pegmatitic dikes (Garnier et al., 2005). Danburite crystals have been found associated with ruby, sapphire, spinel, and tourmaline in the Bai Cat placer deposit, which is surrounded by a series of marble mountain chains. One mountain about 5 km away, An Phu, contains a ruby mine (May Thuong) on one side and a spinel mine (Cong Troi) on the opposite side. While all of Luc Yen’s primary formations of ruby, sapphire, and spinel were favored by metamorphic conditions, its tourmaline originated from pegmatite bodies. The nearest sources of tourmaline are pegmatites in the Minh Tien commune bordering An Phu. The geologic environment of Luc Yen was very suitable for the formation of danburite, which could be related to some pegmatite veins (figure 2). A similar geologic condition has previously been reported for danburite from the Anjanabonoina pegmatite deposit in Madagascar (Wilson, 1989; 2007; Dirlam et al., 2002; De Vito et al., 2006). The pegmatites from both areas are often hosted by marble and locally contain coarse-grained green K-feldspar, tourmaline, and smoky quartz.
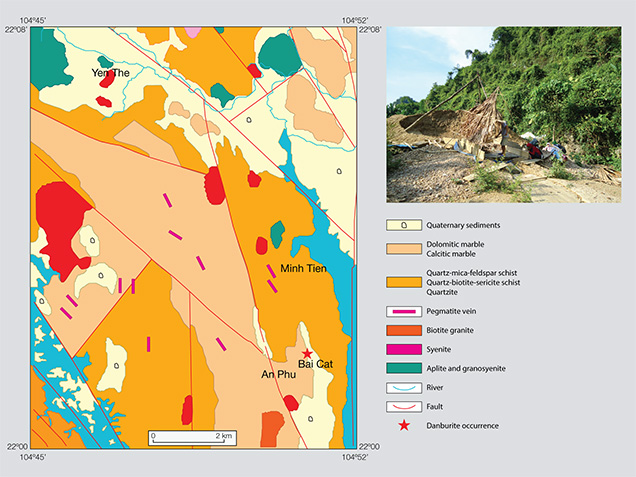
Although the overall production of danburite from Luc Yen has not been evaluated, the output from the Bai Cat deposit appears to be lower than that of ruby, sapphire, spinel, and tourmaline. Danburite remains fairly unknown to most local miners, who mistake it for quartz pebbles.
MATERIALS AND METHODS
For this study, we selected five danburite crystals ranging from 1 to 2.5 cm in length from the Bai Cat placer deposit in the Luc Yen mining area. The samples weighed 12.8 ct (A), 22.5 ct (B), 26.3 ct (C), and 49.6 ct (D), and 15.3 ct (E).
The 26.3 ct sample was cut into a 4.6 ct faceted oval, while the others were polished into parallel-window plates, oriented parallel to the c-axis for gemological analysis and Raman and photoluminescence measurements. Gemological characteristics were examined using a dichroscope, a refractometer, a hydrostatic balance, a 6 W long-wave/short-wave UV lamp (365 and 254 nm, respectively), and an immersion microscope with Zeiss optics. Raman spectroscopy was carried out on a Horiba Jobin Yvon LabRam HR 800 spectrometer equipped with an Olympus BX41 optical microscope and a Si-based charge-coupled device (CCD) detector. Raman spectra were collected in two ranges, from 100 to 1200 cm–1 and 3300 to 3800 cm–1, for all samples. The instrument used a frequency-doubled Nd-YAG laser (532 nm) and a grating with 1800 grooves/mm and a slit width of 100 µm. These parameters, and the optical path length of the spectrometer, yielded a resolution of 0.8 cm–1. The spectral acquisition time was set at 240 seconds with two cycles for all measurements, and sample orientation was carefully controlled. Photoluminescence (PL) spectra were recorded at room temperature on a Horiba Jobin Yvon NanoLog spectrophotometer equipped with a 450 W xenon discharge lamp as an excitation source (240 nm). The recorded range was from 300 to 1000 nm, and spectral resolution was approximately 1 nm. Other spectroscopic techniques (FTIR and UV-Vis) and chemical analyses required further preparation, and the two smallest plates were chosen for these methods. The two larger plates were saved for future research. About 3 mg of material was removed from each of the two plates from inclusion-free regions and ground for FTIR measurements, while the remaining materials were further polished for UV-Vis-NIR and chemical analyses. FTIR spectra of powdered danburite were recorded in the 400–4000 cm–1 range with 64 scans and 4 cm–1 resolution using a Thermo Scientific Nicolet 6700 FTIR spectrometer equipped with an optimized beam condenser. UV-Vis-NIR absorption spectra were recorded in the 200–1600 nm range with 20 scans and a total measurement time of 4 seconds using a Zeiss Axio Imager A2m microscope (0.1 mm beam spot), which was connected with two J&M spectrometers. The first diode array spectrometer (TIDAS S-CCD) works in the 200–980 nm range with a spectral resolution of 0.75 nm and the second one (TIDAS S900 with an InGaAs detector) in the 900–1600 nm range with a resolution of 2.8 nm.
Chemical data were obtained by electron microprobe analysis at the University of Mainz, Germany, and by femtosecond laser ablation–inductively coupled plasma–mass spectrometry (fs-LA-ICP-MS) at the Max Planck Institute for Chemistry in Mainz. Microprobe analyses were performed with a JEOL JXA 8200 instrument equipped with wavelength-dispersive spectrometers, using a 20 kV accelerating voltage and a 20 nA filament current. The spot size of 5 µm and measurement time of three minutes per spot analysis resulted in a peak counting time of 20–30 seconds per element. Calcium and silicon were analyzed by microprobe, with wollastonite used as the standard. LA-ICP-MS data for all elements except Ca and Si were obtained using an NWRFemto femtosecond laser operating at a wavelength of 200 nm in combination with a ThermoFisher Element2 single-collector sector-field ICP mass spectrometer. Before analyses, a pre-ablation (80 μm/s scan speed, 65 µm spot size, and 50 Hz pulse repetition rate at 100% energy output) was performed to reduce any eventual superficial polish residues. The samples were then ablated using line scans of 300 µm length at a scan speed of 5 µm/s and a spot size of 55 µm, achieving an energy density of 0.13 J/cm2 at the sample surface using a pulse repetition rate of 50 Hz. The mass spectrometer was operated using low mass resolution (R=300). Laser ablation was performed in a He atmosphere that was mixed with Ar before entering the plasma area. The applied laser device produces pulses at 150 fs, enabling an almost matrix-independent calibration (Jochum et al., 2014). Important operating parameters for the mass spectrometer are: rf generator power = 1150 W, sample gas (Ar) flow rate = 0.7 L/min, carrier gas (He) = 0.7 L/min, measurement time = 60 s). The glass reference material NIST SRM 610 was used as a calibration material in the evaluation process, where 43Ca was the internal standard. Data reduction and the elimination of obvious outliers were performed following a programmed routine in Microsoft Excel described in Jochum et al. (2007).
RESULTS AND DISCUSSION
Visual Appearance and Gemological Properties. The crystals showed orthorhombic pyramidal faces, some of them broken or rounded, and possessed a nearly identical honey yellow color with slightly different shades. They were transparent with some contaminated cracks. Some samples exhibited color zoning; pleochroism was not observed in any of them. The faceted sample was fairly clean, with no eye-visible inclusions. The refractive indices were nα = 1.630–1.632, nβ = 1.633–1.635, and nγ = 1.636–1.637, with a birefringence of 0.006–0.008. SG values varied between 2.98 and 3.01. All of the samples were inert to short-wave UV radiation and fluoresced strong blue to long-wave UV. Those with a more intense honey yellow color fluoresced more intense blue under long-wave UV. The Vietnamese danburites can be differentiated from those originating from Tanzania (Chadwick and Laurs, 2008), Madagascar (GIA Gems database), and Myanmar (Kiefert, 2007) since the samples from these origins are either inert to both short- and long-wave UV (Tanzania and Madagascar) or fluoresce blue to both (Myanmar).
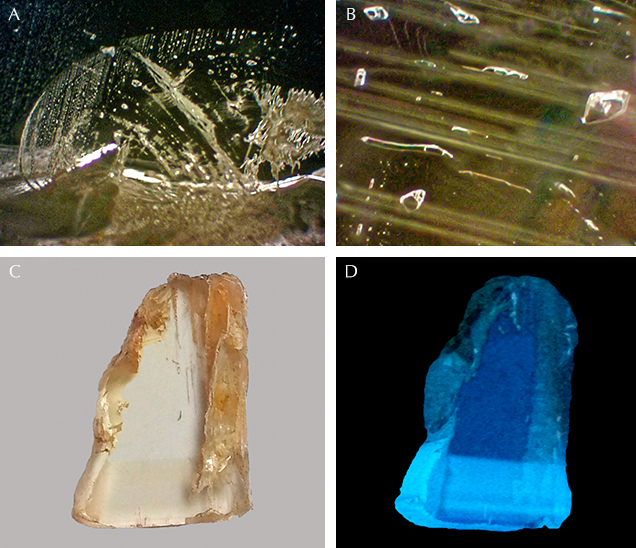
Microscopic observation revealed no mineral inclusions in our Vietnamese danburite samples. Fingerprints were observed in two of them (figure 3A). More often seen were two-phase (gas/liquid) inclusions (figure 3B). Another feature was growth zoning (figure 3C), which was also observed under a long-wave UV lamp as zones exhibiting different blue intensities. The darker zone showed more intense blue luminescence (figure 3D). By correlating these visual observations with the chemical data, we found that the darker sample had a higher total rare earth element (REE) concentration than the lighter one. We therefore assume that the blue luminescence was caused by some REE.
Chemical Composition. The chemical composition of the two analyzed samples is shown in table 1. According to our data, the Luc Yen danburites are characterized by a relatively high concentration of lanthanide elements.
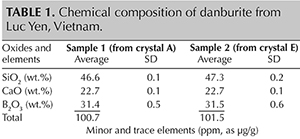
The total lanthanide content for samples 1 and 2 was 782 and 1451 ppm, respectively, whereby the concentrations of light rare earth elements (LREE: La, Ce, Pr, Nd, Sm, and Eu) totaled 777 and 1444, exceeding heavy rare earth elements (HREE: Gd, Tb, Dy, Ho, Er, Er, Tm, Yb, and Lu) by a 250- to 300-fold enrichment. Other notable elements were Al, Sr, Y, Hf, and Pb (concentrations shown in table 1). We identified a very low concentration (0.09–0.16 ppm) of the radioactive element Th. Generally, our danburite samples had extremely low concentrations of transition metals (e.g., Sc, V, Ni, Cu, and Zn). Some other elements were even below detection limits (labeled with an asterisk in table 1). Individual exceptions were Be and Mn, with average concentrations of about 78 ppm and 19 ppm, respectively. The detection limits were calculated using three standard deviations of the gas blank measurements and the element sensitivity of the reference material NIST SRM 610 (Jochum et al., 2005).
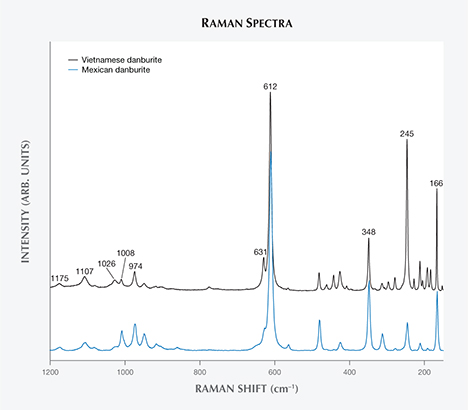
Raman Spectroscopy. Raman spectra of the Luc Yen danburite were collected in the 100–1200 cm–1 range and showed the highest-intensity band at 612 cm–1. According to Best et al. (1994), this band and its shoulder at 631 cm–1 are generated by B-O-Si bending vibration, while the bands at 1026, 1008, and 974 cm–1 are caused by Si-O-B stretching. The two bands of highest frequency, at 1175 and 1107 cm–1, originate from Si-O-Si stretching vibration. The bands in the 500–400 cm–1 region are due to Si-O-Si bending vibration, while those in lower frequencies (including the 348, 245, and 166 cm–1 bands) correspond to Ca translation and torsional modes of the borosilicate framework. Compared with the Raman spectrum of a colorless Mexican danburite in the RRUFF database (see figure 4), Vietnamese danburite shows additional bands between 245 and 166 cm–1. According to one of our comparative studies of danburite composition from various deposits (Huong et al., 2016), the colorless Mexican danburites are fairly free of REE, with total contents of approximately 1.1 ppm. We therefore assume that the bands between 245 and 166 cm–1 are due to Ca translation and torsional modes of the borosilicate framework, which might be caused by the substitution of REEs in the Ca position.
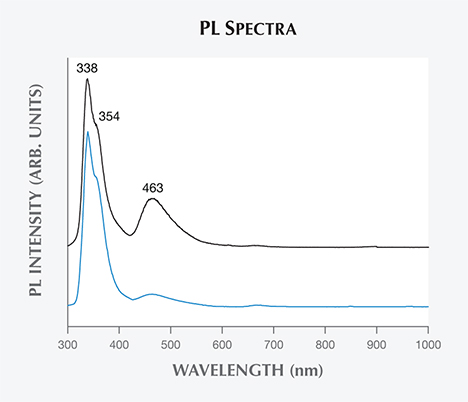
Photoluminescence Spectroscopy. Figure 5 shows room-temperature PL spectra of different color zones within a Vietnamese danburite sample under 254 nm excitation. Both zones (lighter and darker) show intense emission bands at 338 and 354 nm and a less intense broad band at 463 nm. However, PL intensity at the 463 nm emission band is higher and clearer in the darker zone than in the lighter zone. As for the UV emission bands (338 and 354 nm), the PL spectra resemble the typical emission spectra arising from radiative relaxations of Ce3+ ions from 5d to 4f levels (Tang et al., 2005). Thus, we assume that the PL emission in the UV region in this case also comes from the electron transitions of Ce3+ ions. As for the 463 nm emission band, we propose that it results from the presence of REE ions. Note that the 463 nm peak is stronger for the darker (more REE-rich) zones.
FTIR Spectroscopy. Figure 6 shows the IR spectrum of a representative Luc Yen danburite. Some of the main features include the internal modes in the 400–1200 cm–1 range and other modes in the range of water/hydroxyl vibrations from 3000 to 3800 cm–1. In the latter range, we observed one broad band with a maximum centered at 3270 cm–1 and a weak band at 3560 cm–1. According to Beran (1987), OH– species can occupy the O2– positions in danburite’s structure, and charge is balanced by the substitution of Al3+ for Si4+. The broad band seen in the IR spectra of Luc Yen danburite could indicate that OH– substitutes for O2– in different sites rather than just a single oxygen site.
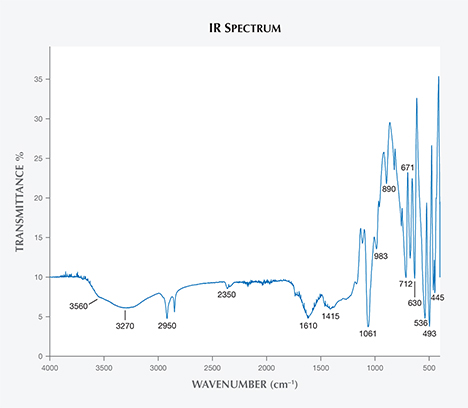
In the 400–1200 cm–1 range, sharp bands are located at 445, 493, 536, 630, 671, 712, 890, 983, and 1061 cm–1. These bands have never been assigned to the danburite structure. But for sorosilicates (with isolated Si2O7 in the structure), bands above 600 cm–1 have generally been assigned to stretching motions of Si2O7 (Kieffer, 1980; Hofmeister et al., 1987). These bands were also assigned to Si2O7 vibrations for lawsonite, CaAl2Si2O7(OH)2·H2O, an isostructural mineral with danburite (Le Cléac’h and Gillet, 1990). Other bands in the 400–600 cm–1 range, when compared with Raman spectra, can be attributed to torsional modes of the borosilicate framework and/or Ca translation. Two absorption bands at 1415 and 1610 cm–1 are due to CO2 and possibly skin fat.
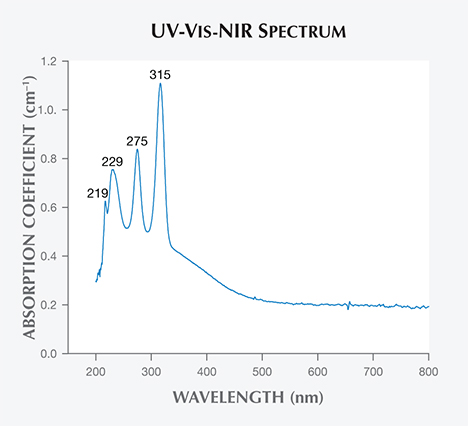
UV-Vis-NIR Spectroscopy. A UV-Vis-NIR spectrum of Luc Yen danburite is shown in figure 7. Absorption increases gradually from the green portion of the spectrum (approximately 500 nm) to the higher-energy end (approximately 200 nm). On the absorption continuum base in the UV region, we observed three dominant peaks at approximately 315, 275, and 229 nm and a shoulder at 219 nm. This observation is different from the reports of Hurwit (1986) and Chadwick and Laurs (2008) for yellow danburite from other sources, which showed a minor peak at 585 nm attributed to REEs. However, the Luc Yen danburite’s sharp and intense absorption peaks in the UV region are typical for electronic transitions in the core of REE ions, especially Ce3+ and Ce4+ (Ebendorff-Heidepriem and Ehrt, 2000; Nicolini et al., 2015). This is validated by the abundance of REEs in the sample (again, see table 1). It is easy to recognize that the Sri Lankan danburites reported by Hurwit (1986) and the Tanzanian samples examined by Chadwick and Laurs (2008) were a different shade of yellow. This is due to their absorption peak at 585 nm, which is not observed in Vietnamese danburite. As for the REE ions in large band-gap materials such as danburites, sharp and intense absorption spectra are often reported due to the energy transitions in the intra-4f electron shell of the trivalent REE dopants. The crystal field effect is caused by interactions between the 4f electrons and the electrons of the host materials, partially or completely lifting the degeneracies of the quantum levels. Thus, different symmetric groups of REE ions in the host materials yield different optical properties. In many cases, however, the fine structure and the relative intensities of the optical transitions in the absorption can be used to probe the local environment of the REE ions, and luminescence spectra are more favorable for higher sensitivity. Relevant transitions for determining the group symmetry are very weak, with absorption cross-sections of about 10–21 to 10–22 cm–1. Finally, the absorption continuum base in the UV region may be due to the absorption band of the host materials.
CONCLUSIONS
Placer deposits at Luc Yen in northern Vietnam host gem-quality danburite that possesses a honey yellow color. The samples are characterized by a high concentration of lanthanide elements (La to Lu) with combined concentrations ranging from 782 to 1451 ppm; concentrations of light rare earth elements exceed heavy rare earth elements by a 250- to 300-fold enrichment. Internal characteristics include fingerprints, two-phase inclusions, and growth zoning. Vietnamese danburites are also inert to short-wave and luminesce blue in long-wave UV. The blue radiation is related to REE impurities. Bands related to REEs are observed in Raman, photoluminescence, and UV-Vis-NIR spectra. Despite being an anhydrous mineral, danburite contains traces of hydroxyl that entered the structure by the substitution reaction OH– + Al3+ = O2– + Si4+. The formation environment of Vietnamese danburite remains an ongoing research project.
