Color Study of Fancy Sapphire from Greenland
Over the past 70 years, several ruby and pink sapphire localities have been documented in the region of Greenland’s capital city, Nuuk (P.W.U. Appel and M. Ghisler, “Ruby- and sapphirine-bearing mineral occurrences in the Fiskenaesset, Nuuk and Maniitsoq regions, West Greenland,” GEUS, Geological Survey of Denmark and Greenland, 2014). Several of these localities are currently exploited on a small scale by the local communities. In 2017, Greenland Ruby A/S started a large-scale mining operation at the Aappaluttoq ruby and pink sapphire deposit, located 160 km south of Nuuk.
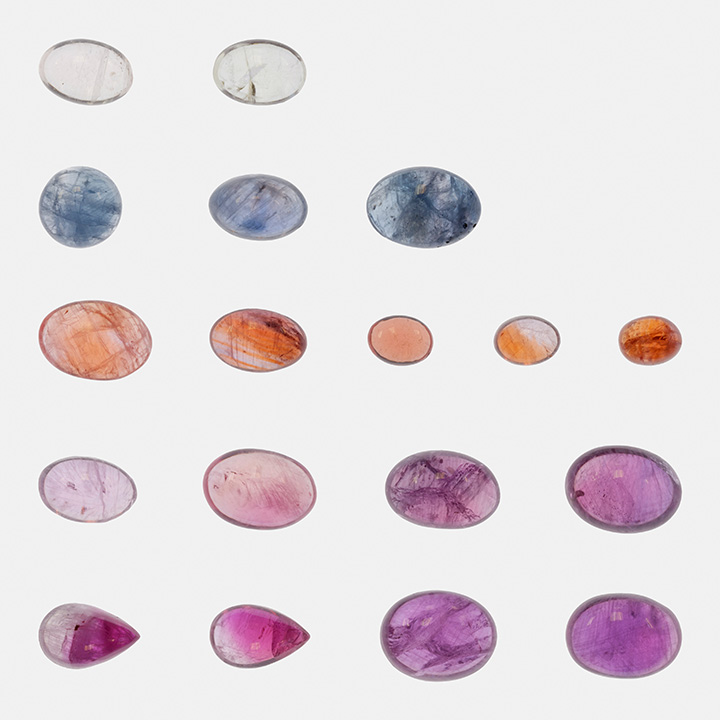
The corundum extracted at Aappaluttoq is heated in air at temperatures over 1500°C for several hours, with some flux added. In rare cases, the heating significantly alters the color of light pink and near-colorless sapphire, resulting in fancy-color sapphire. GIA recently studied a parcel of 22 of these fancy-color sapphires mined and treated by Greenland Ruby (figure 1).
A combination of ultraviolet/visible/near-infrared (UV-Vis-NIR) spectra and trace element chemistry using laser ablation–inductively coupled plasma–mass spectrometry (LA-ICP-MS) were collected at GIA in Bangkok to identify the causes of color. For full quantification of the chromophores, it is necessary to do this analysis in oriented, clean samples with a known path length. Since most of the Greenland material is polished as cabochons and contains some inclusions, it is very challenging to calculate or even estimate the absorption coefficients. We limited ourselves to a rough interpretation of the chromophores based on the shape of the spectra. Orientation of the samples was estimated based on the pleochroism.
Additionally, we could not precisely identify which area of the stone was analyzed during the spectroscopy, and thus all UV-Vis spectra were bulk measurements and combined the color of different zones. In contrast, the LA-ICP-MS analysis was performed at very specific spots, allowing the analysis of specific zones.
The literature describes six chromophores responsible for color in natural corundum (E.V. Dubinsky et al., “A quantitative description of the causes of color in corundum,” Spring 2020 G&G, pp. 2–28). Four of the chromophores from that study are responsible for the colors in this suite.

Most stones from the Aappaluttoq deposit are colored by the Cr3+ chromophore, giving them their typical pink to red color (figure 2). The intensity of the color is directly linked to the concentration of Cr3+, which can go up to several 1000 ppma, and in exceptional cases even to 15,000 ppma. Most of the lighter-colored material has a concentration of a few 100 ppma, resulting in a pink color.

Depending on the orientation, it can appear more purple (when viewed through the c-axis). In some cases, this is so strong that the face-up color of the stone is modified to an extent that it cannot be defined as ruby or pink sapphire and falls into the fancy reddish purple range. Some of the stones develop a more orangy tone after treatment. (A bright orange oval brilliant seen at the 2023 Tucson shows is highlighted in this issue.) This color can be attributed to the creation of trapped holes in combination with Cr3+ (figure 3).
To create trapped holes, the chemical balance in the stone needs to be correct. Only when a stone is acceptor dominated will trapped holes be present. In the case of Greenland ruby, this comes down to the balance between Mg2+ vs. Ti4+, Si4+, and H+. Since the stones have all been treated in air (oxidizing atmosphere), we can assume that H+ has diffused out of them. With the method used to measure trace elements (LA-ICP-MS with a quadrupole MS), we cannot correctly quantify the Si4+ content in these stones. The possibility that Si4+ plays a role in the color cannot be excluded. Regardless, there is no indication here that Si4+ is required to tilt the balance of chromophores when comparing trace elements vs. observed color. Since we do not aim to quantitatively analyze the color, we ignore any potential presence of Si4+. This means that the concentrations of Mg2+ and Ti4+ are the determining factors: Only if the amount of Mg2+ is larger than the Ti4+ concentration can trapped holes develop in sapphire from Greenland.
Two ions in sapphire can pair with trapped holes: Fe3+ and Cr3+. Since the trapped hole preferentially pairs with Cr3+, this is the chromophore observed in these stones. The quantity of trapped holes that can form in corundum is very low, and as such, not all the Cr3+ couples with a trapped hole. The final color will be a combination of the trapped hole color and the pure Cr3+ chromophore, resulting in a combination of pink to red and orange colors. Trapped holes are very strong coloring agents that can have a major impact even when their concentration is very low.

The Fe3+ chromophore is the weakest one encountered in natural corundum. Very high concentrations of Fe3+ are required to create a yellow color, often exceeding several thousand ppma. Since the Greenland rubies have a maximum iron concentration under 1500 ppma, this chromophore creates only a very weak yellow color (figure 4). Other common chromophores are much stronger and more common, which makes it very difficult to notice any color contribution by Fe3+. Only when the Cr3+ concentration is extremely low can we detect the pale yellow color from the Fe3+ chromophore.

The Fe2+-Ti4+ chromophore creates a blue color in corundum and is relatively strong (figure 5). When observed in ruby from Greenland, its effect is usually limited to a slightly increased purplish hue in the chromium-rich corundum, occasionally modifying the color to a dominant purple hue. Only when the Cr3+ concentrations are extremely low is there a chance for the corundum to have a blue color. We still observe some cloudiness after the treatment in the blue zones.
We assume that this type of rough corundum had a milky appearance caused by a high concentration of fine rutile particles before treatment. During treatment at temperatures over 1200°C, some of the particles dissolved into the lattice, becoming available to pair with Fe2+ that was already present and creating a blue bodycolor. Due to the large amounts of Ti4+ that diffused into the crystal lattice, the iron was forced to remain in a reduced state (Fe2+).
The nature of the treated corundum from Greenland makes high-quality spectroscopy a challenge. Nevertheless, we were able to isolate and identify the chromophores responsible for the fancy colors observed in these sapphires.
It is important to note that many of these fancy colors developed as a result of heat treatment. The trapped hole–related chromophores only become visible after H+ diffused out of the stone under oxidizing conditions. These same conditions also allow the iron to oxidize and create the pale yellow color by Fe3+ chromophores. The high temperatures were also required to dissolve rutile particles into the corundum lattice and form Fe-Ti pairs.
While these fancy-color stones remain a curiosity, they make for a welcome addition from a mine that is known for its ruby and pink sapphires.


