Naturally Colored Yellow and Orange Gem Diamonds: The Nitrogen Factor
ABSTRACT
Natural yellow gem diamonds are the most common of the fancy-color diamonds, while orange diamonds are among the rarest when they have unmodified hues. Both categories owe their coloration to atomic-level lattice defects associated with nitrogen impurities in the diamond structure. Four major groups of defects are responsible for the color in nearly all yellow and orange diamonds: cape defects (N3 and associated absorptions), isolated nitrogen defects, the 480 nm visible absorption band, and H3 defects. Nitrogen-bearing diamonds are thought to incorporate isolated nitrogen during growth by substitution for carbon, meaning that natural diamonds start out with yellow to orange color. However, only the very rare type Ib diamonds maintain that original color. With time at high temperatures deep in the earth, the nitrogen atoms in most diamonds aggregate, resulting in either near-colorless stones or yellow diamonds colored by cape defects. Yellow and orange diamonds can be grown in a laboratory or created by color treatments, so a thorough understanding of the defects responsible for color in the natural stones is critical for identification. Yellow diamonds serve as the best ambassador to the colored diamond world due to their abundance and may be the only colored diamond many people will ever see in a jewelry store.
INTRODUCTION
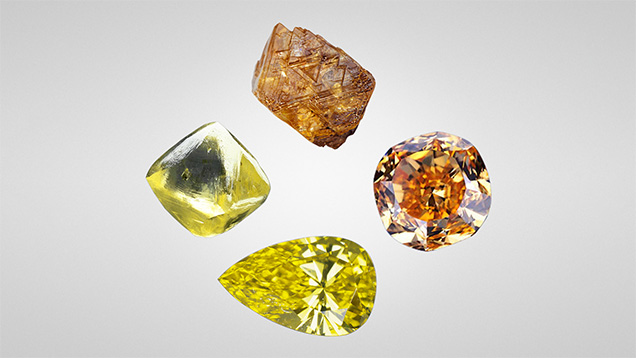
Among fancy-color diamonds, those with saturated blue, green, and red colors are the rarest and generally the most highly valued. Over the last decade, however, diamonds with pure hues in these colors have made up less than one-tenth of one percent of all diamonds examined at GIA, making them virtually unattainable in the marketplace. In recent issues of Gems & Gemology, we have documented the gemological and spectroscopic properties of the rarest of fancy-color diamonds ranging from pink-to-red, blue, and green to the more unusual white and black. This article will address the most common colored diamonds, those with yellow hues, while also examining their much rarer orange cousins (figure 1). This is the last of the fancy color groups in this series, and a brief summary of all the colored diamond groups is provided at the end of the article.
Yellow and orange diamonds owe their color primarily to nitrogen impurities that are incorporated in the diamond lattice during growth deep in the earth. Nitrogen is the most common impurity in natural diamond due to the very similar atomic radii of nitrogen and carbon atoms (155 and 170 picometer Van der Waals radii, respectively) as well as the relative abundance of nitrogen in the growth environment. If nitrogen is present when diamond grows, it will inevitably be incorporated. Nitrogen is the sixth most abundant element in the universe and accounts for more than 75% of the earth’s atmosphere (Bebout et al., 2013). While the amount of nitrogen in the earth’s mantle is significantly lower than that, about 98% of natural gem diamonds recovered (both colorless and fancy-color) are type Ia, meaning they contain FTIR-measurable concentrations of nitrogen impurities, thus proving that nitrogen is present in most diamond growth environments.

Nitrogen can exist as single isolated atoms substituting for carbon (i.e., C-centers, single substitutional nitrogen, or type Ib), aggregated groupings of atoms in pairs or fours (i.e., A-centers or type IaA, and B-centers or type IaB), or as more complex defects (e.g., N3, H2, H3, H4, and NV) (figure 2; see Collins, 1997, 1999, 2001 and Breeding and Shigley, 2009 for more information). Some of these nitrogen defects cause diamond to absorb light in the visible range to cause color (C-centers, N3, H3, and NV) while others produce no color at all in diamond but exhibit characteristic infrared absorptions (A- and B-centers). Simply having nitrogen present in the diamond lattice is not enough to produce a beautiful and rare fancy-color yellow or orange diamond. The nitrogen must exist in high enough concentrations and be configured in a way that selectively absorbs light toward the blue end of the visible spectrum substantially enough to produce yellow or orange color. However, the defects that are responsible for yellow and orange color are not always the same. Most natural yellow gem diamonds are colored by either the N3 defect and its associated absorptions (collectively termed “cape” diamonds by gemologists), or by C-centers (figure 3, A and B). Other color centers such as the 480 nm visible absorption band, H3, and H-related defects occasionally contribute to the color components in yellow diamonds as well (figure 3, C and D). Fancy orange diamonds, however, are nearly always colored by the 480 nm visible absorption band or by C-centers (figure 3, C and B). Orange color is also created occasionally as a primary hue in diamonds colored by the H3 defect in combination with a 550 nm visible absorption band or by nitrogen-vacancy defects.

During the last decade, GIA has examined several hundred thousand naturally colored diamonds with yellow or orange hue components, more than two-thirds of which had pure, unmodified yellow hues. In stark contrast to yellow diamonds, which are by far the most common fancy color, less than one-tenth of a percent of the stones examined over the same period had pure, unmodified orange hues. To our knowledge, data from such a quantity of yellow and orange diamonds has never before been compiled in a publication. As with the previous articles in this series (Breeding et al., 2018; Eaton-Magaña et al., 2018a, 2018b, 2019), our goal is to provide a detailed account of the gemological and spectroscopic characteristics of natural yellow and orange diamonds colored by different nitrogen-related defects.
For the spectroscopic and abundance evaluations, we used a random, representative sampling of 500 diamonds, including both yellow and orange stones. For spectra collection details, please see table S-1 in Breeding et al. (2018). This article is not intended to be a comprehensive review of nitrogen in gem diamond. Instead, it is aimed at helping those in the diamond trade to better understand these beautiful, more common, fancy yellow-colored gems that are far more likely to cross their desks than many of the ultra-rare colored diamonds represented in the previous articles in this series.
CAUSE OF COLOR
Yellow and orange diamonds are closely linked by their dependence on nitrogen-related defects to produce their colors. In fact, the main difference between the two colors is a slight shift in the transmission window in the visible spectrum. Both orange and yellow bodycolors in diamond are produced by a combination of all transmitted visible light above a certain wavelength. Yellow color is seen when most of the nitrogen-related absorptions occur primarily in the blue part of the visible spectrum at wavelengths less than ~510 nm, whereas orange color is seen when the absorptions extend to ~600 nm (figure 4A). Different defects absorb slightly different energy parts of the visible spectrum, meaning that the main defects responsible for yellow color are somewhat different than those for orange color. Of course, the concentration of each defect can range from low to high, and thus the absorption band can shift in wavelength location (figure 4B), and other defects due to plastic deformation may impact the color as well (Hainschwang et al., 2013). This means that the color produced depends not only on the defects present but also their abundance. For example, low concentrations of nitrogen defects can produce pale yellow color, but higher concentrations can increase the overall absorption and thus increase the amount of yellow color and occasionally shift the transmission window into the orange region (figure 4B). Here we discuss the color centers in order of abundance for fancy yellow diamonds. The order of importance for orange diamonds is slightly different and noted in each section below. Table 1 provides a summary of each of the major groups.


“Cape” Defects. The majority of fancy yellow diamonds seen at GIA over the last decade (~74%) are colored primarily by a combination of absorptions from the N3 defect (three nitrogen atoms adjacent to a vacancy; ZPL [zero phonon line] = 415 nm) and its associated absorptions at 451, 463, and 478 nm (N2 defect; Davies, 1981) (figure 3A). These absorption features are associated with “cape” diamonds because they can be seen as a pattern of sharp absorption lines when the diamonds are viewed with a gemological spectroscope. The term “cape” was originally used to refer to pale to deeply colored yellow stones derived from the former Cape Province in South Africa, which was well known for its yellow diamonds (Bruton, 1971; Liddicoat, 1993; King et al., 2005). The term now refers to diamonds from any location with color saturations typically in the light yellow range that are colored by the N3-related absorptions listed above (figure 5). We will collectively refer to these N3-related absorptions as cape defects in this article. The cape defects are also responsible for the slight amount of color in most diamonds in the D-to-Z range of the GIA color grading scale (some D-to-Z diamonds have brownish tints from plastic deformation instead of nitrogen impurities; King et al., 1994, 2005, 2008). Cape defects are largely assumed to be relatively weak light absorbers, meaning that it takes high concentrations of the defects (or longer path lengths of light travel, as with larger faceted diamonds) to produce a saturated yellow color (figure 6). For G-color and N-color diamonds of the same size and cut, for example, the N color will have significantly more cape defects. Similarly, a fancy yellow cape diamond of the same size and cut will have a higher concentration of the defects. Orange color is usually not produced by cape defects.
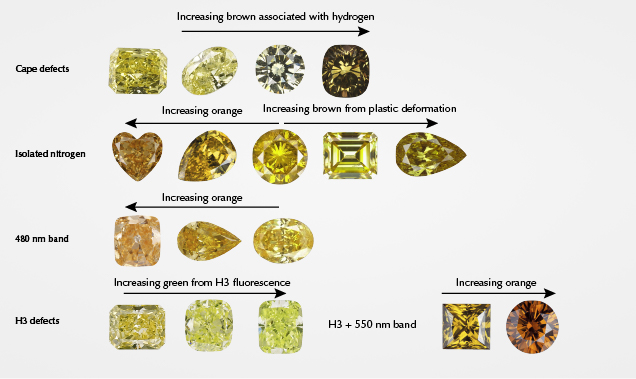

In about 15% of the yellow diamonds colored by cape defects, we observed significant absorption contributions from hydrogen-related defects (see Breeding et al., 2018, for details on H-related defects). Often the yellow diamonds with substantial hydrogen showed brown or green color components from the combination of absorptions from nitrogen and hydrogen-related impurities (figure 5).
Isolated Nitrogen. Single isolated atoms of nitrogen substituting for carbon in the diamond lattice (figures 2 and 3B; C-centers) are the second most common cause of color in natural yellow diamonds, comprising just over 13% of the stones evaluated. C-centers are very strong absorbers, requiring concentrations of only a few parts per million (ppm) of isolated nitrogen atoms to produce strong yellow color (Collins, 1982, 2001; Hainschwang et al., 2013) (figure 6). These diamonds are often referred to as “true canaries” in the industry and are popular in the diamond trade (Liddicoat, 1976; Collins, 1980; Wang and Poon, 2018). While the yellow diamonds analyzed for this study were primarily larger than melee sizes, it should be mentioned that nearly all melee-sized natural diamonds (<0.20 ct) with Fancy yellow or more intense color grades are colored by C-centers due to their very strong light absorption. The short absorption path length in a melee stone requires that C-centers be present to produce yellow color, as cape defects are significantly weaker absorbers and cannot produce much yellow color over very short path lengths (again, see figure 6). C-centers are rare in natural diamond, as they are typically destroyed by combining with other C-centers to form pairs of nitrogen atoms (A-centers) during the normal nitrogen aggregation process that occurs over geologic time during residence deep in the earth (figure 2; Anderson, 1961; Davies, 1970). While C-centers produce strong yellow color in diamond, A-centers produce no color at all. Higher concentrations of C-centers can produce deeper yellow colors (though not always) and orangy components to the diamond hue as well (figure 5). C-centers, in conjunction with plastic deformation (Hainschwang et al., 2013), are the most common cause of primary orange color components in diamond.
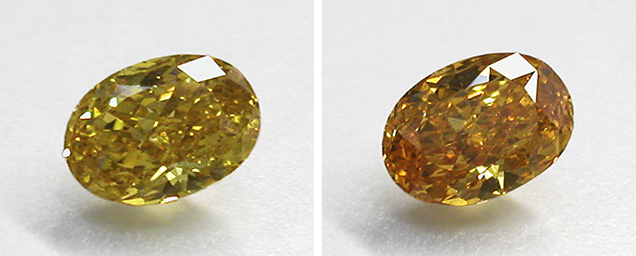
480 nm Visible Absorption Band. One of the more interesting mechanisms for producing yellow color in diamond is a broad absorption band centered at ~480 nm in the visible spectrum (figure 3C). The makeup and structure of the 480 nm band is not well understood by scientists. Our observations indicate that it is almost always associated with both A-centers (nitrogen pairs) and very low concentrations of C-centers. The defect has been attributed by some authors to substitutional oxygen atoms in the diamond lattice based primarily on modeling results (Gali et al., 2001; Shiryaev et al., 2010). Based on a decade of GIA data, the broad absorption is responsible for the color in ~5% of yellow diamonds. Among diamonds with orange hue components, the 480 nm band is the second most common cause of color. However, for diamonds with pure (unmodified) orange hues, this feature is responsible for the color in ~86% of these ultra-rare and highly valued stones. The absorption band at 480 nm also has thermochromic properties, meaning the colors are affected by temperature changes. When a diamond with this feature is heated to 400°–500°C, the absorption band typically broadens and creates a temporary color change to more orangy hues (figure 7). This effect also contributes to the color change in chameleon diamonds (Hainschwang et al., 2005; Breeding et al., 2018), which always exhibit the 480 nm band (Scarratt, 1984; Fritsch et al., 2007b).
H3 Defects. The H3 defect is the next most common cause of color in yellow diamonds. H3 is an uncharged defect consisting of two nitrogen atoms adjacent to a vacancy in the diamond lattice with a ZPL at 503.2 nm (Collins, 1982, 2001; Shigley and Breeding, 2013b, and references therein; figure 3D). H3 absorption can, by itself, produce yellow color and does so in about 2% of our spectroscopic sample set (figure 5). H3 also has a luminescence component that produces green fluorescence to ultraviolet (UV) and visible light (again, see figure 3). As discussed in Breeding et al. (2018), if the H3 concentration is high enough and the A-center concentration is relatively low (to avoid fluorescence quenching), H3 can produce visibly green diamonds (Collins, 2001; Breeding et al., 2018). However, when A-center concentrations are higher, H3 will produce yellow or greenish yellow diamonds.
H3 also frequently combines with plastic deformation–related defects such as the 550 nm absorption band (discussed in Eaton-Magaña et al., 2018b, as the main cause of color in pink diamonds) to produce more orangy yellow to orange colors, as we see in ~4% of the samples surveyed (figures 3 and 5). In fact, this combination of absorptions due to H3 and the 550 nm band is the only other significantly occurring mechanism to produce diamonds with primary orange hues.
OCCURRENCE AND FORMATION
Diamonds grow deep in the earth’s mantle, and by the time they are in a faceted form they generally have no remaining unique characteristics from the geographic region (i.e., country of origin) in which their kimberlites came to the earth’s surface. Nonetheless, certain mines or regions have produced many of the blue (Cullinan mine, South Africa), green (Brazil and Guyana), and pink to red diamonds (Argyle mine, Australia; Lomonosov mine, Russia; Smit and Shor, 2017; Breeding et al., 2018; Eaton-Magaña et al., 2018a, 2018b). This correlation has more to do with the unique geological environment required to produce those colors. For example, most blue diamonds require a source of boron (uncommon in the earth’s mantle) and are thought to grow much deeper in the earth than most other diamonds (Smith et al., 2018). Pink to red diamonds require extensive plastic deformation, while green diamonds usually require extensive residence time in near-surface alluvial settings with the presence of radioactive fluids.
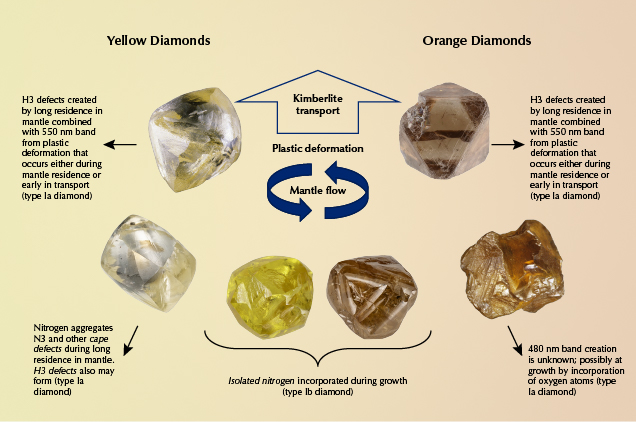
The prevalence of nitrogen in the earth, and diamond’s affinity for nitrogen, means that most areas of diamond formation have readily available nitrogen that will be incorporated during diamond growth. The main factor that controls whether nitrogen-bearing diamonds are yellow tends to be how long they reside at high temperatures deep in the earth (to allow nitrogen atoms to aggregate), which has little to do with geographic regions where kimberlites erupt (figure 8). Consequently, fancy-color natural yellow and orange diamonds are recovered in nearly all mining areas around the world. A few localities are well known for producing high-quality fancy-color yellow diamonds of different types. Type Ia cape diamonds were named for their occurrences in South Africa, and the Ellendale mine in Australia has been a very important source for these types of fancy yellow diamonds (Smit, 2008). Type Ib yellow diamonds (containing C-centers) are relatively rare because most diamonds stay at depth in the earth at high temperatures for prolonged periods of time, causing preexisting C-centers to aggregate to A- and B-centers. A few locations, however, such as the Ekati and Diavik mines in Canada and the Zimmi deposit in Sierra Leone, are well known for their unusually large type Ib yellow diamonds (Shigley and Breeding, 2013a; Smit et al., 2016, 2018).
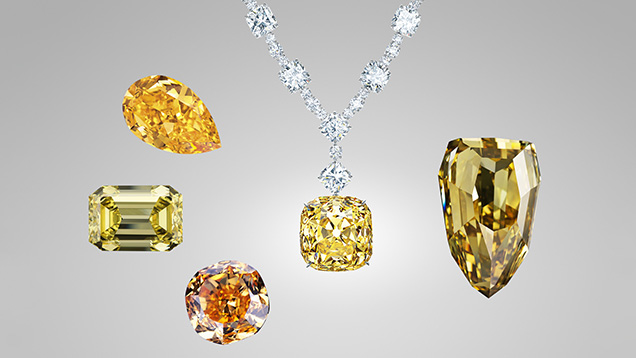
Many very large and famous yellow and orange diamonds have been unearthed and sold for strong prices at auction (figure 9). One of the largest yellow diamonds is the 407.48 ct Fancy Deep brownish yellow (and Internally Flawless) Incomparable diamond, discovered in the Congo. Other famous yellow diamonds include the 128.54 ct Tiffany Yellow (South Africa), the 132.27 ct Florentine (India), the 127 ct Sun of Africa (South Africa), the 101.29 ct Allnatt (likely South Africa), the 30.54 ct Arctic Sun (Canada), and the 4.25 ct Kahn Canary (Arkansas, United States) (Thompson, 2004; Manutchehr-Danai, 2013; http://famousdiamonds.tripod.com). Orange diamonds are considerably rarer than yellows, particularly unmodified pure orange hues, but a few famous ones exist. The largest is The Orange, a Fancy Vivid orange diamond of unknown origin weighing 14.82 ct that sold at auction in 2013 for ~US$2.4 million per carat, a record price at the time (DeMarco, 2013). Another well-known orange diamond is the Pumpkin, a 5.54 ct Fancy Vivid orange stone from the Central African Republic purchased the day before Halloween in 1997 for US$1.3 million (Goldberg, 2015).
GEMOLOGICAL OBSERVATIONS
Fancy yellow and orange diamonds have a few distinctive features that can be seen under magnification with a gemological microscope (table 1 and figure 10). As there are different mechanisms for producing yellow and orange colors, the various groups have somewhat differing characteristics.
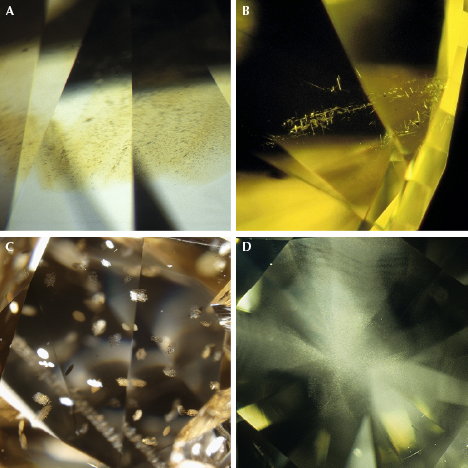
Cape Defects. Cape yellow diamonds tend to have even color distributions and often contain crystal inclusions, much like colorless and near-colorless diamonds. Generally, there is nothing unique about cape diamonds under magnification. Those with significant hydrogen-related defects will sometimes contain finely dispersed particle clouds (figure 10D) that may be zoned in a way that creates a cross-like appearance (Wang and Mayerson, 2002; Rondeau et al., 2004). The cape absorption features (415, 451, 463, and 478 nm) can often be seen as dark lines in a handheld or desk-model spectroscope, and their fluorescence tends to be remarkably consistent, with a moderate to strong blue or yellow reaction to long-wave UV (365 nm) and a weak to moderate yellow to orange reaction to short-wave UV (254 nm) light.
Isolated Nitrogen. Type Ib yellow and orange diamonds often show more distinctive gemological features than the other groups. Under magnification, it is common to see somewhat dense clouds of particle inclusions or groupings of oriented needles in diamonds colored by isolated nitrogen (figure 10, A and B). These clouds and needles are often in particular zones of yellow or orange color that indicate the distribution of C-centers in a diamond. With the spectroscope, only a strong general absorption in the blue end of the spectrum can usually be seen. These diamonds also show rather consistent fluorescence reactions. To both long-wave and short-wave UV, type Ib diamonds are typically inert. If they show any fluorescence, it is usually weak orange, yellow, or green.
480 nm Visible Absorption Band. Yellow and orange diamonds colored by the 480 nm band tend to be variable when viewed in the microscope. Quite often the color looks uniform in faceted stones, but there are subtle zones of yellow or orange intermixed with near-colorless diamond that only show well from fluorescence differences. Diamonds in this group are commonly very included and sometimes show platy oriented groups of inclusions that are somewhat distinctive (figure 10C). A broad absorption band from 450 to 500 nm can often be seen as a dark patch in the spectroscope. The fluorescence from 480 nm band diamonds is very distinctive, with moderate to strong yellow or orangy yellow reactions to long-wave UV and weak to moderate yellow reactions to short-wave UV. These diamonds may phosphoresce a weak to moderate yellow after the short-wave UV lamp is turned off.
H3 Defects. Yellow diamonds colored by the H3 defect can show a range of gemological properties. There are no characteristic inclusions, and color distribution may be uniform or consist of yellow banding. Under fiber-optic illumination in the microscope, these bands (or random areas within the stone) may show green luminescence from the H3 defect. With the spectroscope, a broad absorption from H3 can be seen at wavelengths < 500 nm and, if the stone is cooled with a spray refrigerant or in liquid nitrogen, the ZPL at 503.2 nm may be discernible with a spectroscope. The fluorescence reactions of H3-dominated diamonds tend to be green to both long-wave and short-wave UV. For orange diamonds colored by a combination of H3 and the 550 nm band, most of the features are the same. However, brown grainlines caused by plastic deformation with localized green luminescence from H3 may occasionally be visible with the microscope. The green luminescence is not usually strong or widely distributed enough to affect the bodycolor.
LABORATORY SUBMISSIONS AND GRADING
Of the yellow and orange diamonds submitted to GIA over nearly a decade, 40% were in the one- to two-carat size range (figure 11, left). The overall size distribution included 29% weighing less than one carat and 28% weighing from two to ten carats. About 3% of the stones exceeded 10 ct. Unlike D-to-Z diamonds, where round shapes are most common, the yellow and orange diamonds were most often cut into cushions (33%) or cut-cornered rectangles (19%) (figure 11, right). Rounds (13%), pears (12%), and ovals (9%) were the next most common shapes. Clarity grades covered the entire grading range, and no discernible trends were noted.

The color grade distribution was strongly skewed toward unmodified yellow hues (~79%), followed by greenish yellows with occasional gray or brown components (~9%), combinations of orange and yellow with occasional brown components (i.e., orange-yellow, yellowish orange, brownish orangy yellow, etc.; ~6%), brownish yellows (~5%), brown-oranges (~1%), and finally the extremely rare unmodified orange hues (0.05%). In addition, the color saturation was strongly skewed toward Fancy Light and greater, with Fancy the most common. The reason for this skew is that yellow diamonds with unmodified hues in the Faint, Very Light, and Light ranges are classified on the D-to-Z grading scale and are therefore not included in this dataset (King et al., 1994, 2008).

As mentioned earlier, a random sampling of 500 natural yellow and orange diamonds was examined to assess the causes of color (figure 12). From these data we see that cape defects (sometimes including hydrogen) accounted for almost three-quarters of the stones (73.6%; figure 12). Isolated nitrogen was the coloring agent in 13.2%, followed by H3 (sometimes including 550 nm plastic deformation band) at 6.2%, the 480 nm visible absorption band at 5%, and a few oddities making up the final 2%. While these data describe the various causes of color in the group as a whole, they are significantly skewed toward the much higher population of yellow diamonds. Interesting characteristics can be seen by comparing the causes of color in stones with yellow or orange as the primary color component (e.g., “brownish orangy yellow” would be primarily yellow, while “brownish yellowish orange” would be primarily orange and “orange” alone would be termed as an unmodified hue here) to the distribution of the unmodified yellow and orange hues. Among the primarily yellow diamonds, ~81.5% were colored by cape defects (sometimes including hydrogen), ~10.5% by isolated nitrogen (or type Ib), 3.3% by the 480 nm band, and ~3% by H3 (with or without the 550 nm band; figure 12). Stones with unmodified yellow hues had a very similar distribution of defects, with ~84.5% capes, ~11% isolated nitrogen, ~3% 480 nm band, ~0.5% H3, and a few oddities (figure 12).
The 500-stone data set was largely composed of yellow diamonds, so in order to similarly evaluate the primary and unmodified orange diamonds, data from GIA’s nearly decade-long intake of orange diamonds (both primary and unmodified, more than 13,000 stones) were screened for color origin. Orange diamonds, however, show a marked difference between those with primary and unmodified orange hues. The causes of color in orange diamonds with additional color components are nearly evenly distributed between isolated nitrogen (~50%) and the 480 nm visible absorption band (46%), with the remainder (4%) consisting mostly of stones with H3 and plastic deformation and a few colored by NV centers (figure 12). Orange diamonds with pure, unmodified hues are extremely rare (< 200 seen at GIA in the last decade) and strikingly consistent in their cause of color, with ~86% from 480 nm bands, ~13% from isolated nitrogen, and less than 1% from other mechanisms (again, see figure 12). From these data, it is apparent that some unique aspect of the 480 nm visible absorption band contributes to a purer, unmodified orange hue.
ABSORPTION SPECTROSCOPY
Absorption spectroscopy is a powerful tool for examining colored diamonds. This nondestructive method directly measures the major impurities in the diamond lattice (infrared absorption, measured at room temperature) as well as defects that are responsible for color (visible absorption, measured at ~77 K; i.e., liquid nitrogen temperature). Each of the different causes of color in yellow and orange diamonds has characteristic features that can be identified using absorption spectroscopy. Here we present representative spectra from each of the groups to illustrate the differences.
Infrared Absorption (FTIR). Natural fancy-color yellow diamonds colored by cape defects have remarkably consistent FTIR spectra, regardless of color. All of these diamonds are type Ia with extremely high concentrations of nitrogen impurities (often >1000 ppma total nitrogen) that cannot be fully resolved by the detectors of FTIR instruments (i.e., the absorption peaks exceed the vertical scale of the graph; figure 13). Both A-centers (1282 cm–1) and B-centers (1175 cm–1) are present, but usually no C-centers (1130 and 1344 cm–1) can be detected, which is typical of most type Ia diamonds. This is a product of the natural aggregation process where C-centers (isolated N) aggregate to A-centers (paired N) and finally to B-centers (four N and a vacancy) with enough time at high temperatures inside the earth (figure 2; Anderson, 1961; Davies, 1970). Cape diamonds also have strong platelet peaks (variable position from ~1360 to 1375 cm–1; Allen and Evans, 1981; Breeding and Shigley, 2009), as well as a series of three broad infrared absorptions at ~1490, 1525, and 1550 cm–1 that occur almost exclusively in diamonds with cape defects (figure 13A). In most fancy-color yellow cape diamonds, two additional relatively broad FTIR absorptions can usually be seen at 1430 and 1450 cm–1; these are always proportional to each other in intensity. The 1450 cm–1 feature has a peak position very similar to that of the H1a interstitial radiation-related defect (Collins, 1982; Zaitsev, 2003), but in cape diamonds the feature is broader and unrelated to radiation exposure. For cape diamonds with hydrogen impurities, a peak at 3107 cm–1 (three nitrogen atoms adjacent to a vacancy with a hydrogen atom; Goss et al., 2014; figure 13A) and related modes at 1405 and 4495 cm–1 are ubiquitous and generally vary in intensity with hydrogen content.

Yellow and orange diamonds colored by isolated nitrogen always show the related features at 1344 and ~1130 cm–1, but otherwise the FTIR spectra are somewhat variable. These occur as type Ib diamonds dominated by C-center absorption, type IaA + Ib diamonds with a combination of A-center and C-center absorptions (figure 13B), or diamonds dominated by A-aggregates with trace concentrations of C-centers. Because C-centers are such strong absorbers, it only takes a few ppm to produce strong yellow color. Consequently, the amount of isolated nitrogen is often quite low in both types (usually <100 ppma; concentrations calculated using a modified version of a deconvolution spreadsheet provided by Dr. David Fisher of DTC Research Center, Maidenhead, UK; Boyd et al., 1994, 1995). Very special geological conditions that are not completely understood are required for C-centers to be preserved at all in natural diamonds. A-center concentration ranges from a few ppma to a few thousand ppma and may be higher or lower than the C-center concentration in different samples. Additional FTIR absorptions of unknown structure at 1353, 1358, 1363, and 1373 cm–1 commonly occur in yellow and orange diamonds with isolated nitrogen (figure 13B). Weak H1b (4935 cm–1) absorption also occurs in many type Ib diamonds. Hydrogen absorptions similar to those in cape diamonds sometimes occur, as well, along with a series of tiny peaks in the 3000–3500 cm–1 range that are hydrogen-related and seem to correlate with a defect described as the Y-center (Hainschwang et al., 2012). We have only observed these 3000–3500 cm–1 features in diamonds with isolated nitrogen. Finally, plastic deformation often occurs in yellow type Ib diamonds and is represented by “amber center” absorptions (usually occurring at 4165, 4110, or 4065 cm–1; Massi et al., 2005), especially in brownish yellow stones or those with an olive greenish hue.
Yellow and orange diamonds colored by a 480 nm visible absorption band are nearly always type Ia and usually have low to moderate concentrations of A-centers, but sometimes they show very irregular and distorted one-phonon regions in the infrared spectrum that are not well understood (figure 13C). In some samples, trace concentrations of C-centers can also be detected. Hydrogen impurities are variable, but when present, they occur with the same peaks mentioned above for isolated nitrogen yellows.
Yellow diamonds colored by H3 defects are quite variable in their FTIR spectra. H3 absorbs and emits light (luminesces) simultaneously. Diamonds colored by H3 are always type Ia with variable proportions of A- and B-centers (figure 13D). For greenish yellow stones, the total nitrogen, as well as the A-center concentration, is always relatively low to allow the H3 green luminescence to be seen along with the yellow from absorption. In H3-dominated yellow diamonds with high A-center concentrations (saturated), the green luminescence from H3 is completely quenched (Collins, 1982, 2001), leaving only the yellow color from H3 absorption. Similar to cape diamonds, the platelet, 1430 cm–1, and 1450 cm–1 features as well as occasional H-related features are seen in all H3 diamonds. In contrast, brownish yellow and orange diamonds colored by the combination of H3 and a 550 nm visible absorption band are extremely consistent as type IaA diamonds with moderate amounts of total nitrogen, a weak platelet peak, and the presence of amber centers (Massi et al., 2005; Eaton-Magaña et al., 2018b) that mark the plastic deformation related to the 550 nm band.
Ultraviolet-Visible/Near-Infrared Absorption (UV-Vis-NIR). Much like their FTIR spectra, the UV-Vis-NIR spectra of natural yellow diamonds colored by cape defects are extremely consistent, with the N3 ZPL (Collins, 1982, 2001; Zaitsev, 2003; Shigley and Breeding, 2013b) at 415 nm, a related broad absorption band to shorter wavelengths, as well as the other N3-related cape absorption features at (listed in order of intensity) 478 (N2), 451, 463, 435, and 426 nm (figure 14A). The last three cape peaks listed only appear with increasing saturation of the yellow color. The observed yellow color comes primarily from the absorptions from N2 and the 451 nm band, with only minor contribution from the N3 itself, but all the cape peaks are proportional in intensity to N3. If hydrogen-related defects are present, two broad asymmetric bands centered at ~730 and ~836 nm often occur along with a smaller peak at 563 nm (figure 14A), causing the color to have brownish or greenish components.

UV-Vis-NIR absorption in yellow and orange diamonds primarily colored by isolated nitrogen is quite different. A very strong absorption by C-centers occurs in the UV range at ~270 nm (Jones et al., 2009) (not shown). Even with a few ppm of C-centers, the absorption is so strong that the absorption “tail” extends into the visible range, creating an absorption continuum to ~510 nm in yellow hues and ~600 nm in orange-hued type Ib diamonds (figure 14A). This gradually increasing absorption toward the UV is the only feature seen in the UV-Vis-NIR spectra of most of these diamonds.
Yellow and orange diamonds colored by the 480 nm band show the so-named broad absorption centered at roughly 480 nm (figure 14A) along with another broad absorption at 370 nm and a much weaker band at 427 nm (not shown). Occasionally a weak N3 peak at 415 nm can also be seen. The intensity and, to some extent, the shape of the 480 nm band are variable and do not always correlate with the intensity of yellow or orange color. More notably, the 480 nm absorption extends only to ~550 nm in nearly all of these stones, even in the orange fancy-color diamonds. Absorption color calculations indicate that the resulting color should be mostly yellow in all cases, strongly suggesting that the luminescence discussed in the next section accounts for part of the color in the orange stones (Titkov et al., 2015).
H3-dominated yellow diamonds produce relatively simple UV-Vis-NIR absorptions with the H3 ZPL at 503.2 nm (Collins, 1982, 2001; Shigley and Breeding, 2013b) and its related absorption band to shorter wavelengths as their major feature (figure 14B). When plastic deformation is also present, a broad 550 nm band and an underlying increase in overall absorption toward the UV caused by vacancy clusters accompany the H3 absorptions to extend the absorption edge to ~620 nm and produce brownish orange hues (figure 14B). Often, weak 535.8 nm and H2 (986 nm) absorption peaks are also seen in these diamonds.
LUMINESCENCE SPECTROSCOPY AND IMAGING
In addition to absorbing energy, many defects also emit light (or luminesce) when exposed to certain wavelengths of light. The two major forms of luminescence used in gemology are referred to as photoluminescence and fluorescence, typically depending on whether a laser or UV lamp is used for excitation and whether the collection occurs at liquid nitrogen or room temperature.
Photoluminescence (PL). PL is a very sensitive, nondestructive analytical technique that involves exposing a diamond to light of known energy (i.e., with a wavelength in the UV, visible, or infrared range) and measuring any new light that is given off as a result of atomic-level interactions within the diamond. PL analysis is usually performed with the sample at liquid nitrogen temperature (~77 K) and can detect diamond defects as low as a few parts per billion (ppb) (Eaton-Magaña and Breeding, 2016). Each cause of color in yellow and orange diamonds shows a few distinctive features in the PL spectra.
Natural yellow cape diamonds consistently exhibit a number of PL peaks including 415 (N3), 496 (H4), 503.2 (H3), 508, 535, 604, 660, 700, 787, 911, 933, and 952 nm. Besides the strong N3 at 415 nm that contributes to the cape absorption that causes the yellow color, the most prominent tend to be the 700 and 787 nm features, which have been attributed to nickel, nitrogen, and likely hydrogen impurities (Fritsch et al., 2007a; figure 15A). In cape diamonds with abundant hydrogen, these two peaks tend to be very strong, and the NE8 Ni-N defect (Yelisseyev and Kanda, 2007) consistently appeared at 793 nm.

For yellow and orange diamonds colored by isolated nitrogen, the following PL peaks are often detected: 503.2 (H3), 525, 565.8, 575 (NV0), 578, 604, 637 (NV–), 689, 698, 805, 830, 904, 953, and 986 nm (H2). Of these, the most significant are the NV centers at 575 and 637 nm (figure 15B) and the H2 defect at 986 nm. The abundance of C-centers, which are electron donors, tends to provide extra electrons to adjacent defects to make them negatively charged (Collins, 1982, 2001). In type Ib diamonds under 514 or 532 nm laser excitation, the 637 (NV–)/575 (NV0) ratio is almost always >1, and the H2 defect (two nitrogen atoms adjacent to a vacancy in a negative charge state) is ubiquitous due to the available electrons.
PL spectra from 480 nm band stones are noticeably different from those exhibited by the other groups. Between 550 and 700 nm, nearly a hundred small PL peaks are sometimes observed with 488 nm laser excitation. Overall, the following peaks are commonly seen: 589, 592, 616, 619, 678, 683, 693, 709, 723, 799, 807, 817, 883/885, and 904 nm. Of these, the 799 and 883/885 nm doublet are most noteworthy. The 799 nm peak occurs in all 480 nm band diamonds evaluated, and the 883/885 nm doublet is the well-studied 1.4 eV Ni center (Yelisseyev and Kanda, 2007). More significant seems to be the broad luminescence band in the red end of the spectrum, centered at ~670–700 nm, when a blue or green laser is used for excitation of some 480 nm band diamonds (figure 15C; first described in Collins and Mohammed, 1982). This band signifies red luminescence to visible light (from laser excitation in this case) that likely plays a role in the color of some orange diamonds. As discussed in the UV-Vis-NIR section earlier, 480 nm band absorption alone produces only yellow color. However, the combination of that absorption and this red luminescence is likely the cause of orange color in the majority of the world’s most beautiful orange diamonds (Titkov et al., 2015).
Yellow diamonds colored by H3 and orange diamonds colored by the combination of H3 and the 550 nm plastic deformation band both show relatively similar PL spectra, with emissions at 496 (H4), 503.2 (H3), 535.8, 575 (NV0), 637 (NV–), 657, 700, 741 (GR1), 804, 812, 953, and 986 (H2). Apart from the very strong H3 PL peak (figure 15D), the only other notable observation was that the 535.8 nm peak was often much larger in stones with the 550 nm visible absorption band (not shown).
Deep-UV Fluorescence. Earlier in the gemological observations section, we discussed the fluorescence reactions of each group to standard short-wave and long-wave UV light. Here we further examine the deep-UV (<230 nm excitation) fluorescence reactions of the groups observed using a DiamondView instrument. Due to the extreme absorption of UV at these and shorter wavelengths by diamond, this high-energy excitation only stimulates fluorescence from the surface of a diamond, thus providing a highly resolved image of fluorescence distribution within different diamond growth events and sectors (Welbourn et al., 1996).
Cape diamonds mostly show strong blue fluorescence to deep UV (due to N3 defects), often with distinctive growth bands forming multiple rectangles within each other from octahedral growth (figure 16A). Occasionally a thin, bright green band of fluorescence from localized H3 defects is observed following the growth pattern in some areas. Hydrogen content has little effect on the deep-UV fluorescence.
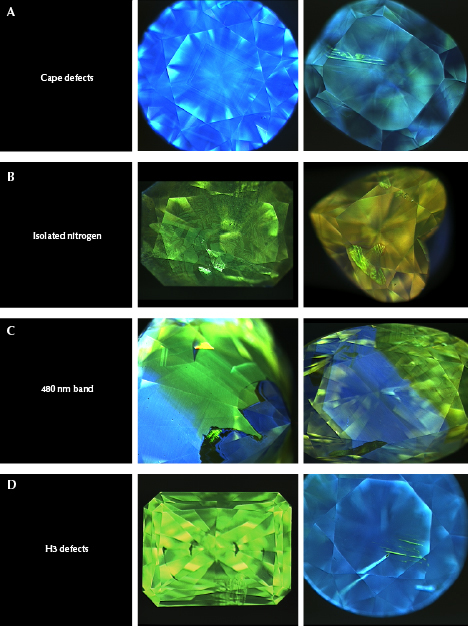
Yellow and orange type Ib diamonds often have irregular deep-UV fluorescence patterns, seemingly suggesting more chaotic, possibly unstable growth environments recording periods of diamond growth and resorption. These images show variable patterns of green (H3), orange (NV0), or pink to red (NV–) fluorescence or some combination of those (figure 16B). Oftentimes the red or green fluorescence follows lines of plastic deformation within the diamonds, suggesting that some of the fluorescence was created after diamond growth during deformation. Overall fluorescence in type Ib diamonds is relatively low in intensity to deep UV.
Diamonds colored by the 480 nm band tend to be even more irregular. Deep-UV imaging shows dark blue (N3), light blue (unknown defect), greenish yellow (correlated with the 480 nm band), and occasionally green (H3) fluorescence. Inert areas between other fluorescence colors are common as well (figure 16C). These textures suggest multiple stages of diamond growth under different conditions with different defects incorporated. Their irregular patterns are markedly similar to chameleon diamonds, which also exhibit the 480 nm band (Scarratt, 1984; Hainschwang et al., 2005; Fritsch et al., 2007b), suggesting a genetic link.
H3-dominated yellow diamonds show very strong green fluorescence (H3) that appears uniform or is isolated to lines of plastic deformation (figure 16D). Blue fluorescence (N3) is common as well, especially in stones with localized green fluorescence. Most of the orange diamonds with H3 and 550 nm bands show the green fluorescence associated with H3 very localized along the plastic deformation slip planes.
IDENTIFICATION CONCERNS
Identification of fancy-color diamonds involves determining whether a stone grew in the earth or in a laboratory, and whether the color we see is natural or has been artificially created by treatment. Yellow diamonds (and those with orange hue components) can easily be created in a laboratory using the high-pressure, high-temperature (HPHT) growth method (figure 17). As mentioned above, nitrogen is extremely abundant in the atmosphere and thus readily available in an HPHT growth chamber unless strict measures are taken to remove it. Under normal conditions of growth, most HPHT lab-grown diamonds are yellow to orange in color depending on how much nitrogen gets incorporated as C-centers. These mostly type Ib diamonds show typical features related to their growth in a laboratory such as color zoning that follows cuboctahedral growth patterns, particle clouds, metallic flux inclusions, and a lack of birefringence (direct measurement of lattice strain) under cross-polarized magnification (Eaton-Magaña et al., 2017, and references therein). Natural yellow and orange diamonds colored by C-centers have absorption spectra similar to those of their lab-grown counterparts but can usually be separated by the presence of natural inclusions, uniform to irregular color zoning, wispy clouds, and a distinct strain pattern. On rare occasions, both HPHT lab-grown and natural yellow diamonds can be type Ia with traces of isolated nitrogen, but the same separation criteria apply and lab-grown diamonds generally do not have cape defects in visible absorption. Chemical vapor deposition (CVD) methods can be used to grow yellow diamonds with isolated nitrogen, but it is rarely done and most of the products lack the color saturation of HPHT-grown samples (Kitawaki et al., 2015; Eaton-Magaña and Shigley, 2016). CVD-grown diamonds can occasionally have orange hue components if subjected to post-growth irradiation and annealing treatments to create relatively low concentrations of NV centers.
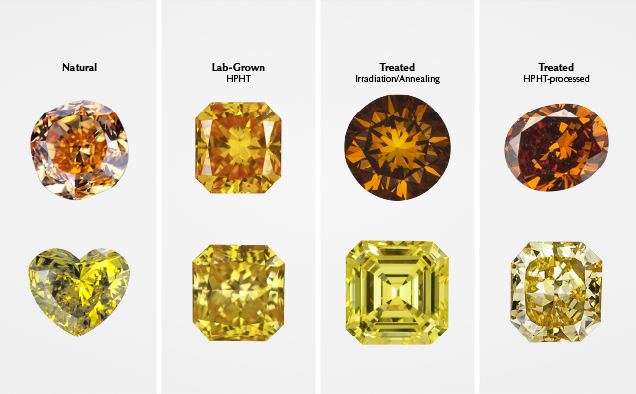
Determining whether the yellow or orange color in an earth-grown gem diamond is natural or artificially produced through treatment is a more challenging endeavor. Cape-related defects, as a group, cannot be added or removed through any known commercial treatment, so their presence is generally a good indicator that the diamond naturally exhibited some yellow color. However, it is relatively easy to create H3 defects through artificial irradiation and annealing treatment that absorbs blue light to create yellow color (figure 17). This can be done on an off-color brown diamond to make it yellow or even on a pale yellow cape diamond to intensify the color. Natural radiation exposure and heating in the earth can have similar effects, making the separation even more difficult. Extreme amounts of irradiation and annealing can turn most nitrogen-bearing diamonds to an orange to brown color, but this degree of treatment is easily spotted using absorption spectroscopy. Another form of color enhancement that is harder to detect is HPHT treatment of type I diamonds. At pressures and temperatures higher than those in the earth where most diamonds grow, HPHT treatment can cause the creation of H3 defects as well as the breakup of aggregated nitrogen into isolated nitrogen (Collins, 2001). Both H3 and these newly created C-centers will give a diamond a yellow color (again, see figure 17). If the starting material is a cape diamond, the addition of C-centers during treatment can produce an orange color. HPHT treatment may produce graphitized feathers or inclusions or frosted facets that are not properly repolished afterward. Irradiation and annealing treatments may leave yellow or orange color zones near the culet. However, it is often impossible to gemologically identify these types of treatments, and all fancy-color diamonds should be sent to a laboratory for conclusive determination of color origin.
UNUSUAL EXAMPLES
Yellow diamonds are the most common of the fancy-color diamonds and are dominated by the groups of color-causing defects described here. As with anything in nature, though, there are a few examples of unusual yellow diamonds that do not perfectly fit the categories. In our previous colored diamond articles, we have presented a few odd samples in this section. Here we will discuss two other ways to produce yellow color involving isolated nitrogen: type IaB yellow diamonds colored by isolated nitrogen and growth-zoned yellow diamonds with type Ia cores and type Ib rims.
For most natural diamonds, the aggregation path from C-centers to A-centers to B-centers is a one-way route that usually progresses to some point with a combination of A- and B-centers. The transformation from A- to B-centers is the point at which most N3 defects are created in nature, and thus most cape diamonds fall somewhere therein. We have already discussed the unlikelihood of preserving C-centers in natural yellow diamonds, but not in the more maturely aggregated type IaB diamonds. Occasionally GIA receives a Fancy to Fancy Intense yellow diamond that is type IaB with extremely weak C-center absorption and no cape defects. These unusual stones are bothersome, as B-aggregates of nitrogen should not coexist naturally with C-centers. It is common to disaggregate some nitrogen aggregates during HPHT treatment (~2000°C, 6 GPa; Dobrinets et al., 2013) to form new C-centers, but these conditions do not seem feasible for natural diamond-forming environments, and the presence of B-centers with C-centers in an FTIR spectrum usually arouses suspicion that treatment is involved. However, there are a handful of naturally intense yellow diamonds that are highly aggregated (mostly type IaB), but still have enough traces of C-centers to produce their saturated colors, perhaps indicating very rare, HPHT-like conditions in the earth. These diamonds usually have small feathers on their natural surfaces from movement in an alluvial environment and contain PL features indicating they are naturally colored, despite similarities with HPHT-treated yellow diamonds.
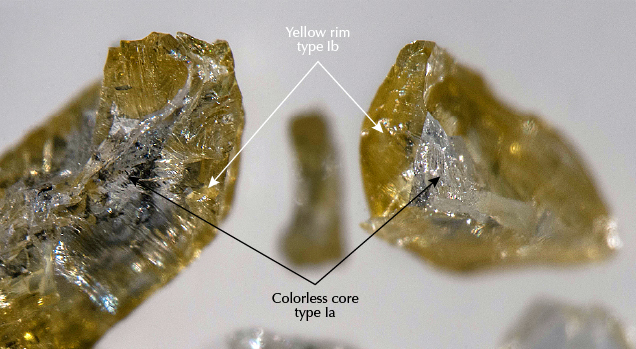
Another unusual group of yellow fancy-color diamonds seen at GIA and by Hainschwang et al. (2006) displayed FTIR spectra with A-, B-, and C-centers that normally do not exist naturally. However, the diamonds seen at GIA were sourced from the Ekati mine in Canada and were known to have never been treated (Lai et al., 2019). After breaking a couple of the melee-sized rough diamonds, we discovered they consisted of near-colorless cores and yellow rims from two different episodes of diamond growth (figure 18). FTIR analysis is a bulk measurement technique, meaning the spectrum recorded is an average of all of the path lengths within the diamond through which the infrared beam passes. Thus, a diamond like this will show both the A- and B-centers from the core along with the C-centers from the rim in the same spectrum. Occasionally at GIA, we see larger faceted yellow gem diamonds with only small amounts of yellow color concentrated near the surface (enough to achieve a Fancy color grade) and the remainder of the stone is colorless. We refer to these as “yellow-skin” diamonds, but their FTIR spectra are often more indicative of a treated-color diamond due to the mixed sampling. These diamonds represent the larger version of the melee-sized Ekati stones that have had much of their yellow outer rim removed during faceting. With careful examination, gemologists can conclusively identify these diamonds as natural, but they are definitely unusual.
COMPARISON OF ALL FANCY-COLOR DIAMONDS
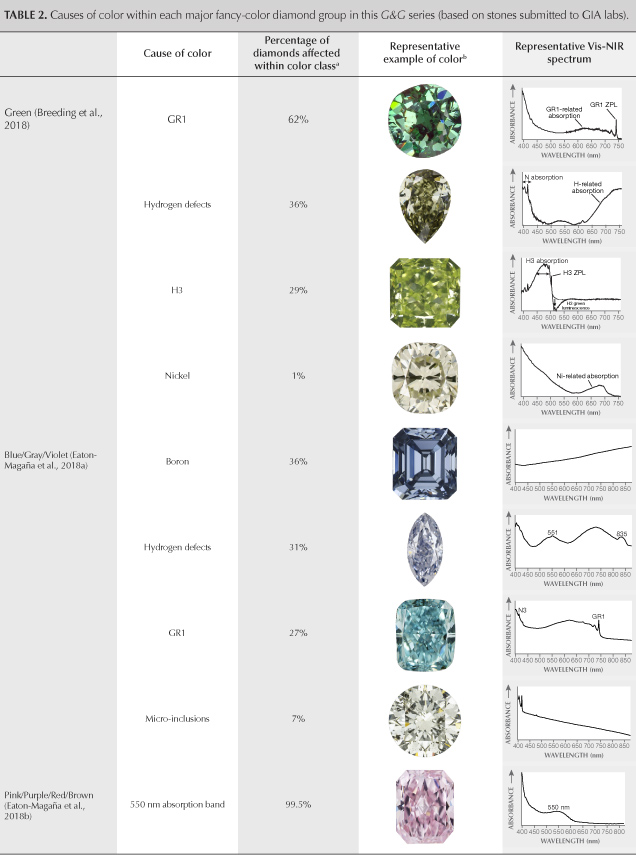
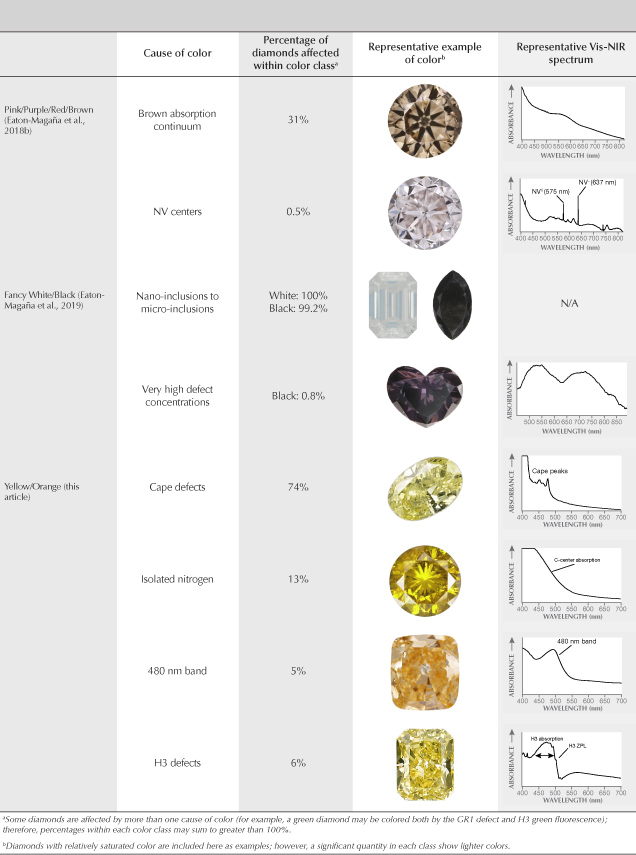
This article completes the fancy-color portion of this series in Gems & Gemology. The final article will look principally at colorless diamonds and the rest of the D-to-Z scale. We wish to conclude this exploration of fancy-color natural diamonds by providing a brief summary and comparison of all five diamond color groups: green (Breeding et al., 2018), blue/gray/violet (Eaton-Magaña et al., 2018a), pink/purple/red/brown (Eaton-Magaña et al., 2018b), white/black (Eaton-Magaña et al., 2019) and yellow/orange (this article). Table 2 lists the major causes of color in descending order of abundance within each of the color groups in the diamonds seen at GIA.
CONCLUSIONS
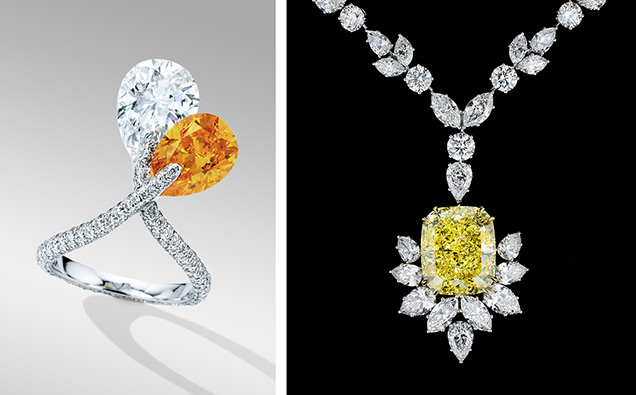
Yellow and orange are the largest group of fancy-color diamonds and owe their color to four major causes associated with nitrogen impurities: cape defects, isolated nitrogen, the 480 nm visible absorption band, and H3 defects (table 1). Cape defects are by far the most important color-producing mechanism for yellow diamonds, accounting for nearly three-quarters of the diamonds evaluated, while isolated nitrogen and the 480 nm band are most important for orange stones. Yellow and orange diamonds are recovered from almost all diamond mines worldwide, but South Africa and the Central African Republic have produced some of the most famous and valuable examples. Yellow and yellowish orange lab-grown diamonds are easy to produce by the HPHT growth method, and diamond color treatments routinely create yellow and orange colors by creating H3 or isolated nitrogen defects through HPHT treatment or artificial irradiation and annealing. Cape defects (as a group) and the 480 nm band, however, are usually not present in lab-grown diamonds. Yellow diamonds are the only natural colored diamonds that many people will ever see in the industry and serve as an important representative for the fancy-color diamond trade, while orange diamonds with unmodified hues are among the rarest of all fancy-color diamonds (figure 19).
.jpg)


