Thai-Myanmar Petrified Woods
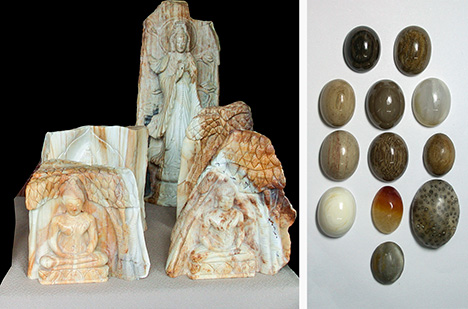
Petrified woods (figure 1, left) have long been used as a gem and ornamental material due to their beauty, luster, durability, and relative rarity. Certain minerals (mainly quartz, opal, or moganite) crystallize or precipitate in the hollow cavities and cells of the woods in a fossilization process. Fossil trading is government regulated in some countries, and gemologists should know the useful identifying characteristics of petrified woods, which can be misidentified as jasper and agate. With this in mind, the author examined Thai-Myanmar petrified wood samples, fashioned as cabochons (figure 1, right), for gemological characterization.
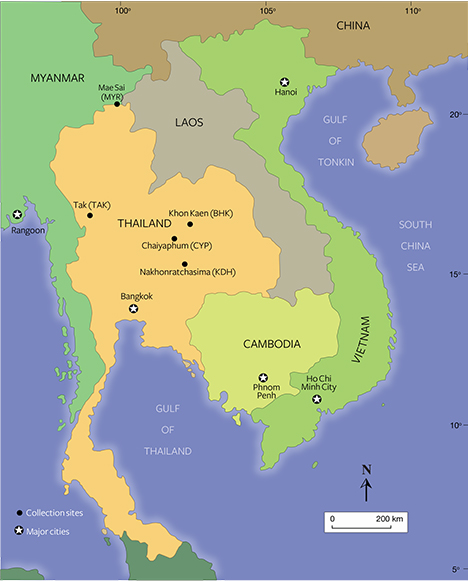
More than 100 Thai samples were collected from the four localities shown in figure 2: Tak, in Ban Tak-Oke (TAK); Khon Kaen, in Ban Hin Khao (BHK); Chaiyaphum, in Noen Sa Nga (CYP); and Nakhonratchasima, in Kroke Duan Ha (KDH). About 100 Burmese samples were donated by carvers from Mae Sai in Chiang Rai province (MYR), near the border of Thailand and Myanmar. Thai specimens were collected from either Quaternary gravel beds of fluvial deposits or the high-terrace sands and gravels of paleorivers. Tektite grains found in the sediments date back 700,000 to 900,000 years (P. W. Haines et al., “Flood deposits penecontemporaneous with ~0.8 Ma tektite fall in NE Thailand: Impact-induced environmental effects?” Earth and Planetary Science Letters, Vol. 225, 2004, pp. 19–28).
Thirty-eight samples (all but seven from Thailand) were tested by standard gemological methods, Raman spectroscopy, and X-ray diffraction (XRD). Thirty-seven of these came from dicotyledonous plants, indicated by vascular bundles concentrated in an outer ring of active growth. Periods of slow (winter) and fast (summer) growth create the growth rings in the trunk. One sample came from a palm tree, and had vascular bundles dispersed throughout the trunk.
The rough surfaces may have been altered and stained by soil or iron oxides, resulting in black, brown, cream, white, and red coloration. Colorless areas and different shades of brown, black, gray, white, cream, yellow, orange, and red appeared below the surface. Some samples exhibited color banding. Most Thai samples were opaque or nearly opaque; those from Myanmar were translucent and lighter in tone. The surfaces showed varying degrees of luster and fracturing. Refractive indices ranged from 1.425 to 1.543 (tested at the flat polished base of the cabochon), and specific gravities ranged from 1.963 to 2.616. Most samples fluoresced weak to moderate chalky white under long-wave UV, but some were inert or showed very weak white fluorescence.
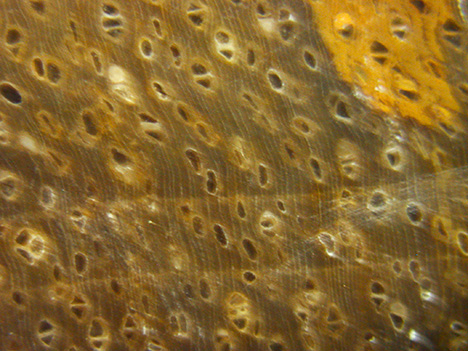
A gemological microscope can often reveal a well-preserved wood grain structure in petrified wood samples. Studies of wood structure generally involve the transverse, tangential, and radial sections of the trunk (R.F. Evert, Esau’s Plant Anatomy: Meristems, Cells, and Tissues of the Plant Body: Their Structure, Function, and Development, 3rd ed., John Wiley & Sons, Hoboken, New Jersey, 2006, pp. 203, 292–296). A transverse section of one of the samples (figure 3) showed several tiny oval-shaped pores filled with quartz or opal (e.g., S. Saminpanya and F.L. Sutherland, “Silica phase-transformations during diagenesis within petrified woods found in fluvial deposits from Thailand-Myanmar,” Sedimentary Geology, Vol. 290, 2013, pp. 15–26). The samples also showed thin parallel rays, groups of cells oriented perpendicular to the trunk’s main axis. In some samples, the parenchyma (the most common plant tissue cells) consisted of pale lines or bands running across the rays. Others showed parenchyma surrounding a pore on the long and parallel wood grains of the tangential section, or dark-colored pores extending the length of the trunk. On the radial section, the pores ran the length of the trunk, with wood grains perpendicular to the pores.
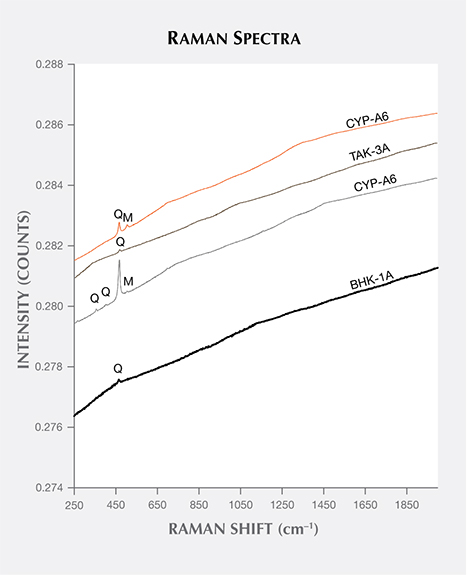
Raman spectra were characteristic of opal (according to the RRUFF database, rruff.info), quartz, and moganite (K.J. Kingma and R.J. Hemley, “Raman spectroscopic study of microcrystalline silica,” American Mineralogist, Vol. 79, 1994, pp. 269–273). Figure 4 shows the peaks for the TAK, BHK, and CYP samples; peaks for KDH (which included opal) and MYR samples were previously presented (Saminpanya and Sutherland, 2013). Most of the quartz material displayed peaks at 354, 395–397, and 464–466 cm–1, with different colors within a sample exhibiting different peak intensities. Some samples showed only major peaks of quartz at 464–466 cm–1. Moganite was mixed with quartz in one sample apiece from CYP, KDH, and MYR, indicated by peaks at 503–506 cm–1, close to the reference peak of 501 cm–1 (Kingma and Hemley, 1994). Two KDH samples showed bands centered at 1587 and 1607 cm–1, characteristic of opal (Saminpanya and Sutherland, 2013), which was probably responsible for the weak to moderate chalky white fluorescence in some of the samples.
XRD showed that the quartz peaks had an average 2Θ of 21.0, 26.7, 36.6, 39.6, 40.4, 42.5, 45.9, 50.2, and 55.0 degrees; the opal-CT peaks had an average 2Θ of 20.7, 21.7, 36.0, 44.0, and 56.9 degrees (again, see rruff.info). Quartz appeared in the XRD peaks of samples from all localities, but the opal-CT was found only in samples from KDH and MYR. The diffractogram of opal-CT in one sample from KDH appeared noisy. This may be due to its amorphous nature, though extending the XRD scan times may improve the resolution of the peaks. At this stage, XRD can only detect quartz and opal from these samples.
