A Foundation for Grading the Overall Cut Quality of Round Brilliant Cut Diamonds
ABSTRACT
GIA began its 15-year study of diamond cut by using a computer to model the way light behaves within a round brilliant cut diamond. From this model, GIA researchers developed proportionbased metrics to predict how diamonds would perform with regard to brilliance and fire. Continued research revealed several important variables that could not be evaluated effectively by computer modeling alone. Thus, the authors asked diamond manufacturers, dealers, retailers, and potential consumers to evaluate brightness (a term selected as more appropriate than brilliance), fire, and overall cut appearance of diamonds representing many different proportion combinations.These observations and discussions confirmed that additional factors, besides brightness and fire, contribute to diamond cut appearance, and that factors in addition to face-up appearance are important in assessing the quality of a diamond’s cut.With the trade interactions as a foundation, the authors (1) tested the brightness and fire metrics to find the best fit with human observations, (2) identified and quantified factors in addition to brightness and fire that contribute to face-up appearance, (3) developed a standard viewing environment that mimics common trade environments, (4) created the foundation for a comprehensive diamond cut grading system, and (5) began development of reference software to predict the overall cut grade of a particular diamond. The GIA diamond cut grading system described here includes the components of brightness, fire, scintillation, polish, and symmetry, as well as weight and durability concerns, into a single overall grade for cut quality for standard round brilliants.
Of the Four Cs (color, clarity, cut, and carat weight), cut is the least understood—and least agreed upon—aspect of diamond appearance. Current claims about the superiority of certain round brilliant diamond cuts focus mostly on three approaches:
- The use of specific sets of proportions (e.g., those for the AGS 0, the AGA 1A, “Class 1” cuts [as previously taught by GIA Education], the HRD “Very Good” grades, “Ideal” cuts, and “Tolkowsky” cuts)
- The use of viewing devices to see specific patterns or pattern elements in diamonds (e.g., FireScope, Symmetriscope, IdealScope, and various “Hearts-and-Arrows”–style viewers)
- The use of proprietary devices, such as the GemEx BrillianceScope and ISEE2, which measure one or more of the following aspects of diamond appearance: brilliance, fire, scintillation, and/or symmetry
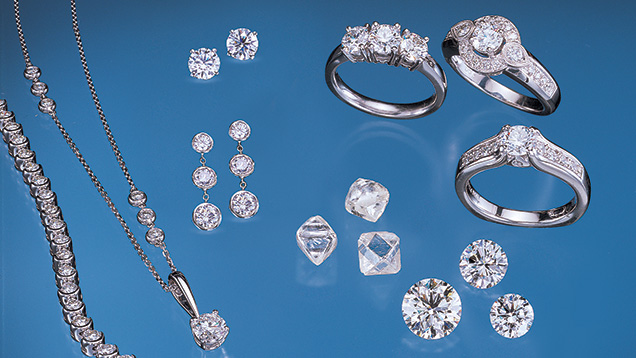
For GIA’s research on the evaluation of diamond cut, we started with a different approach, based on the following questions: What makes a round brilliant cut (RBC, figure 1) diamond look the way it does? To what degree do differences among cutting proportions create observable distinctions? Which proportion sets produce results that are deemed attractive by most experienced observers? The first stages of our research—which utilized advanced computer modeling—were described briefly by Manson (1991), and then in detail by Hemphill et al. (1998) and Reinitz et al. (2001).
Many other groups have used some formof computer modeling to predict appearance aspects of diamond proportion sets, including: Fey (1975), Dodson (1978, 1979), Hardy et al. (1981), Harding (1986), van Zanten (1987), Long and Steele (1988, 1999), Tognoni (1990), Strickland (1993), Shigetomi (1997), Shannon and Wilson (1999), Inoue (1999), and Sivovolenko et al. (1999). To our knowledge, however, few if any of these other studies validated their modeling results by using observation tests of actual diamonds, a major component of the research described in the present article. The validation of computer modeling by observations is essential in the evaluation of diamond cut appearance, as without this validation there is a risk of producing results that are not applicable to the real-world assessment of diamonds.
In this article, we discuss the key aspects of a well-cut diamond. We describe how we tested our previously published metrics (numerical values based on mathematical models) for brilliance and fire by conducting observations with actual diamonds in typical trade environments and then developed new metrics based on our results. We also explain how we validated these new metrics with further observation tests, and developed and tested additional methods, including environments and procedures, for evaluating other essential aspects of diamond appearance and cut quality. Finally, on the basis of the information gathered during this extensive testing, we constructed a comprehensive system for assessing the cut appearance and quality of round brilliant cut diamonds. The present article discusses the framework of this system, further details of which will be made available in later publications.
BACKGROUND AND TERMINOLOGY
The face-up appearance of a polished diamond is often described in terms of its brilliance (or brilliancy), fire, and scintillation (see, e.g., GIA Diamond Dictionary, 1993). Historically, however, diamond appearance has been described using other terms as well; even the addition of scintillation to this list has been a relatively recent development (see, e.g., Shipley, 1948).
Today, while brilliance, fire, and scintillation are widely used to describe diamond appearance, the definitions of these terms found in the gemological literature vary, and there is no single generally accepted method for evaluating and/or comparing these properties in diamonds. Further, experienced members of the diamond trade use additional terms when they assess the appearance of diamonds. In the course of this study, we interviewed dozens of diamond manufacturers and dealers, in various international diamond cutting centers and at trade shows. (We also interviewed retailers and jewelry consumers, as described below.) We found that, in addition to brilliance, fire, and scintillation, they tended to use words such as life, pop, lively, dull, bright, or dead to describe a diamond’s cut appearance, although they could not always explain precisely what they meant by such terms. In some cases, they would know whether or not they liked a diamond, but were unable to articulate exactly why.
To avoid potential confusion in describing cut appearance, we have refined and expanded the definitions of three essential terms, so that they more clearly and accurately reflect what experienced observers see in actual diamonds in everyday environments. Throughout this article, we will use the following definitions (see the glossary on p. 223 for a list of key diamond cut terms used in this article):
- Brightness—the appearance, or extent, of internal and external reflections of “white” light seen in a polished diamond when viewed face-up. Note that although we originally used brilliance to describe this property (Hemphill et al., 1998; Reinitz et al., 2001), as we proceeded further with our study, we found thatmany individuals in the trade and general public include other appearance aspects (such as contrast) in their use of that term. Hence, we decided to use brightness instead.
- Fire—the appearance, or extent, of light dispersed into spectral colors seen in a polished diamond when viewed face-up.
- Scintillation—the appearance, or extent, of spots of light seen in a polished diamond when viewed face-up that flash as the diamond, observer, or light sourcemoves (sparkle); and the relative size, arrangement, and contrast of bright and dark areas that result frominternal and external reflections seen in a polished diamond when viewed face-up while that diamond is still or moving (pattern).
Note that the definitions for fire and scintillation differ from those currently found for similar terms in the GIA Diamond Dictionary (1993) and those given in the two earlier G&G articles about this study. They replace those definitions, and brightness replaces brilliance, for the purposes of this article and the forthcoming GIA diamond cut grading system.
Our interviews also confirmed that, in addition to brightness, fire, and scintillation, the design and craftsmanship of the diamond, as evidenced by its physical shape (e.g., weight and durability concerns) and its finish (polish and symmetry), are important indicators of a diamond’s overall cut quality.
MATERIALS AND METHODS
This (third) stage of research evolved from that presented in our previous two articles on diamond appearance (Hemphill et al., 1998; Reinitz et al., 2001). Initially, we focused this stage on exploratory testing, to compare our computer-modeled predictions of brightness and fire with observations by experienced trade observers of selected actual diamonds. We found that the observers generally agreed with each other but, in many cases, not with our predictions. We used these findings to create and test additional brightness and firemetrics, using a broader group of observers and diamonds.
Extensive observation testing with diamonds was needed to: (1) determine how well the original and subsequent metric predictions compared to actual observations; (2) establish thresholds at which differences defined by the model are no longer discerned by an experienced observer; (3) see the broad range of effects that might be statistically significant with a large and varied sample of diamonds; (4) determine what additional factors must be considered when assessing diamond cut appearance and quality; and (5) supply enough data for overall preferences to be revealed amid the widely varied tastes of the participants.
Analysis of the observation data did reveal which metrics best fit our observation results. It also outlined discernible grade categories for our metric results by identifying those category distinctions that were consistently seen by observers. To determine what additional factors were not being captured by our computer model, we returned to the trade and asked individuals their opinions of diamonds that were ranked with our new brightness and fire metrics. Although a majority of these diamonds were ranked appropriately when metric results were compared to trade observations, many were not. By questioning our trade observers, and through extensive observations performed by a specialized team (the “Overall observation team”), we explored additional issues related to face-up appearance (sparkle and pattern) and cut quality (design and craftsmanship) that proved to be essential when assessing a round brilliant’s cut quality. These observation tests also supplied data that emphasized the importance of considering personal and global preferences when assessing and predicting diamond cut appearance and quality.
Last, we combined the findings of our observation testing and trade discussions with the predictive and assessment capabilities of our brightness and fire metrics to develop a comprehensive system comprised of all the factors identified in this latest phase of research. This became the framework of our diamond cut grading system.
Methods of Observation Testing. Testing for individual and market preferences is called hedonics testing (see, e.g., Ohr, 2001; Lawless et al., 2003) and is often used in the food sciences. Among the types of tests employed are acceptance tests (to determine if a product is acceptable on its own), preference tests (comparing products, usually two at a time), difference tests (to see whether observers perceive products as the same or different; that is, which levels of difference are perceptible), and descriptive analysis (in which observers are asked to describe perceptions and differences, and to what degree products are different). At various times throughout our research, we used each of these.
The observations focused on individual appearance aspects (such as brightness and fire) as well as on the overall cut appearance and quality of polished diamonds. The format and goal of each set of observation tests were determined by the questions we hoped to answer (e.g., Will pairs of diamonds ranked in brightness by our brightness metric appear in the same order to observers?), as well as by the findings of previous observation tests. In this way, as our study evolved, we varied the specific diamonds used in testing, the environments in which the diamonds were viewed, and the questions that we asked.
Our first observation tests for this project were performed in February 2001; since then, we have collected more than 70,000 observations of almost 2,300 diamonds, by over 300 individuals. (Approximately 200 observers were from all levels of the diamond trade or consumers, and about 100 were from the GIA Gem Laboratory and elsewhere at GIA, as described below.)
The trade press has reported on the use of diamond observations to test appearance models (e.g., Scandinavian Diamond Nomenclature [SCAN DN] in 1967, mentioned by Lenzen, 1983; Nahum Stern at the Weitzmann Institute of Science in Israel, circa 1978 [“Computer used . . .,” 1978]), although to the best of our knowledge no results have been published. In addition, we at GIA have used statistical graphics in the past to explain observational results (see, e.g.,Moses et al., 1997). Thus, this work is an application (and extension) of previously applied techniques.
Diamonds. We purchased and/or had manufactured a set of diamonds of various proportions (some rarely seen in the trade), so that the same set of samples would be available for repeated and ongoing observation tests. These 45 “Research Diamonds” made up our core reference set (see table 1). Some data on 28 of these diamonds were provided by Reinitz et al. (2001).
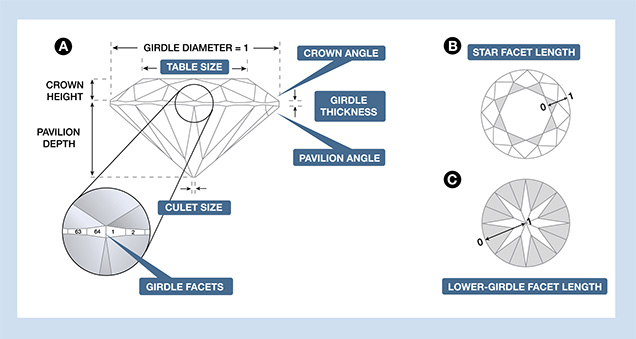
In our computer model, assumptions were made about color (D), clarity (Flawless), fluorescence (none), girdle condition (faceted), and the like.We recognized that actual diamonds seen in the trade would differ from their virtual counterparts in ways that would make the model less applicable. Therefore, to expand our sample universe, we augmented the core reference set with almost 2,300 additional diamonds (summarized in table 2) temporarily made available by the GIA GemLaboratory. These diamonds provided a wide range of weights, colors, clarities, and other quality and cut characteristics. All of these diamonds were graded by the GIA Gem Laboratory and measured using Sarin optical measuring devices. In addition, we developed new methods for measuring critical parameters that previously had not been captured (for a description of the proportion parameters measured and considered, see figure 2).
| TABLE 2. Ranges of properties and proportions for 2,298 other diamonds used for verification testing.a | ||
| Parameter |
Brightness and fire verification diamonds |
Overall Verification Diamonds (OVDs) |
| No. of Diamonds | 688 | 1,610 |
| Weight range | 0.20–1.04 ct | 0.25–14.01 ct |
| Clarity |
Internally flawless–I3 |
Internally flawless–I3 |
| Color | D–Z | D–Z |
| Fluorescence intensity | None to very strong | None to very strongb |
| Fluorescence color | Blue | Blue, white, yellowb |
| Table size | 52–72% | 46–74% |
| Crown angle | 23.0–42.5° | 22.5–42.0° |
| Pavilion angle | 37.6–45.6° | 37.2–44.0° |
| Lower-girdle facet length | 60–95% | 55–95% |
| Star facet length | 40–70% | 35–70% |
| Depth percent | 51.5–71.2 | 52.8–72.0 |
| Crown height | 7.0–20.0% | 6.5–19.5% |
| Polish | Excellent to fair | Excellent to fair |
| Symmetry | Excellent to fair | Excellent to fair |
| Culet size | None to very large | None to very large |
| Girdle thickness | Very thin to extremely thick | Very thin to extremely thick |
| Girdle condition | Faceted, polished, bruted | Faceted, polished, bruted |
| Total no. observations per diamond | 9–29 | 3–15 |
| Brightness observations per diamond | 3–11 | 0c–3 |
| Fire observations per diamond | 5–15 | 0c–3 |
| Overall appearance observations perdiamond | 1–3 | 3–8 |
|
a See figure 2 for a description of diamond proportions mentioned in this table.
b We saw only an extremely small number of fluorescent diamonds in the very strong range, or in white or yellow; we found the effects of these particular qualities to be insignificant for the diamonds observed. c Brightness and/or fire observations were not conducted for some of the Overall Verification Diamonds. |
||
Observers. Experienced diamond manufacturers and brokers make purchasing and cutting decisions based on aesthetic and economic considerations. To begin the verification process for our brightness and fire metrics, we watched these individuals as they examined some of our Research Diamonds, both in the environments where they usually make their daily decisions about diamond cut and appearance, and in a variety of controlled environments (detailed below). In general, we asked them what we thought were straightforward questions: “Which of these diamonds do you think is the brightest, the most fiery, and/or the most attractive overall? What differences do you see that help youmake these decisions?”
Interactions with trade observers were used in two ways. First, they provided an initial direction for this stage of our research project, reinforcing which aspects of cut quality needed to be considered in addition to brightness and fire. Subsequently, they served as guidance; throughout our research, we returned to trade observers to compare against the findings we received fromour internal laboratory teams.
A summary of our observers (including number and type) is given in table 3. Our core trade observers (“Manufacturers and Dealers” and “Retailers” in table 3) are experienced individuals from around the world who routinely make judgments on which their livelihoods depend about the quality of diamond manufacture. Many of these men and women have decades of experience in the diamond trade, and most of them routinely handle thousands of polished diamonds per week. (Because retailers typically sell diamonds in different environments from those in which manufacturers and dealers evaluate them [see below], we generally analyzed their observations separately.) The results of these trade observations were used to define our initial quality ranges for brightness, fire, and overall face-up appearance, as well as to provide useful information on other essential aspects of diamond cut quality.
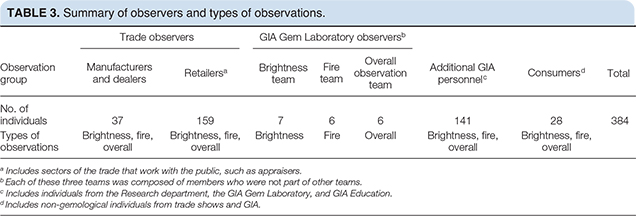
To expand our population of experienced diamond observers, we also established several teams of individuals from the GIA Gem Laboratory to carry out the numerous observations that we conducted. We developed a team of “Brightness observers” who saw the same differences in brightness (within a five-diamond set of our Research Diamonds, RD01–RD05; again, see table 1) as our trade observers did in a comparable environment. We assembled a different group of specialized individuals to serve as our “Fire observers.” Last, we assembled a team of six individuals from the GIA Gem Laboratory (our Overall observation team) who combined had more than 100 years of experience viewing diamonds. This team, whose members did not participate in any of the other teams, conducted several sets of tests that focused on judging diamonds for their overall cut appearance and quality. The GIA Gem Laboratory observers were asked to examine larger populations of selected diamonds and to answer the same kinds of questions as those posed to the trade observers. Early testing showed that the responses of the lab groups were consistent with those of the trade observers.
Two other groups who took part in observations were less experienced GIA personnel and consumers. In this way, we met our goal of considering observations frompeople at all levels of the diamond trade, as well as consumers.
Viewing Environments. To discover how individuals in the trade normally evaluate diamonds on a day-to-day basis, we asked them detailed questions about their working environments, and we observed them while they assessed diamonds in these environments. This revealed their everyday observation practices such as colors of clothing, colors of the backgrounds on which they viewed diamonds, light intensity, lighting and viewing geometry, light-source specification, and how they held and moved diamonds when viewing them.
Our observers examined diamonds in a number of different environments, some variable and some controlled, including:
- Their own offices and workplaces (using desktop fluorescent lamps)
- A conference room at the GIA offices in New York (using similar desk lamps and/or the viewing boxes described below)
- Retail showrooms (usually consisting of a mix of fluorescent and spot lighting)
- “Retail-equivalent” environments at GIA in Carlsbad and New York, set up according to recommendations by a halogen light-fixture manufacturer (Solux)
- Standardized color-grading boxes, including two commercially available boxes (the Graphic Technology Inc. “Executive Show-Off” Model PVS/M—the “GTI” environment—and the Macbeth Judge II Viewing Booth, both with daylight- equivalent D65 fluorescent lamps)
- At least three versions of a standardized viewing box of our own design (the common viewing environment, or “CVE”)
- A variety of patterned hemisphere environments (to imitate computer-modeled environments)

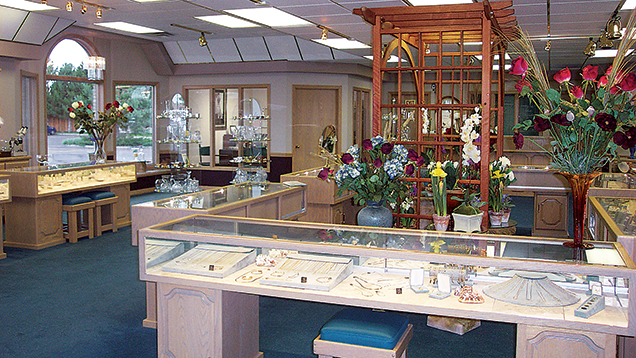
The same diamond can look quite different depending on the type and position of lighting that is used (figure 3). On the one hand, for cutting diamonds and for evaluating brightness and the quality of diamond cutting in general, most manufacturers use overhead fluorescent lights and/or desk lamps with daylight-equivalent fluorescent bulbs; dealers and brokers generally use similar desk lamps in their offices (figure 4). However, this type of diffuse lighting suppresses the appearance of fire (again, see figure 3). On the other hand, retail environments generally provide spot, or point source, lighting (usually with some overall diffuse lighting as well), which accentuates fire (figure 5).

appearance and cut quality in offices with fluorescent desk lamps.Objects in the room,
including the observer, can block or affect light shining on the crown of a polished diamond.
Photo by A. Gilbertson.
Therefore, when we wanted solely to study the effects of brightness, we used dealer-equivalent lighting, which consisted of daylight-equivalent fluorescent lights mounted in fairly deep, neutralgray viewing boxes (e.g., the Macbeth Judge II, as is used for color grading colored diamonds; see King et al., 1994). Similarly, when we wanted to study only the effects of fire, we used our retail-equivalent lighting, which consisted of a series of three halogen lamps mounted 18 inches (about 46 cm) apart and six feet (1.8 m) from the surface of the work table, in a room with neutral gray walls that also had overhead fluorescent light fixtures.
For observation of overall cut appearance, we developed a GIA “common viewing environment” (CVE [patent pending]), a neutral gray box (shallower than the Macbeth Judge II or GTI environment) with a combination of daylight-equivalent fluorescent lamps and overhead white LEDs (lightemitting diodes; figure 6). We established the optimum intensity of the fluorescent lamps by observing when a set of reference diamonds showed the same relative amounts of brightness as they showed in the dealer-equivalent lighting. The intensity of the LEDs was determined by identifying a level at which fire was visible in diamonds but the relative amounts of brightness were still easy to observe accurately. In this way, we were able to observe brightness and fire in a single viewing environment that preserved the general qualities of both dealer and retail lighting.
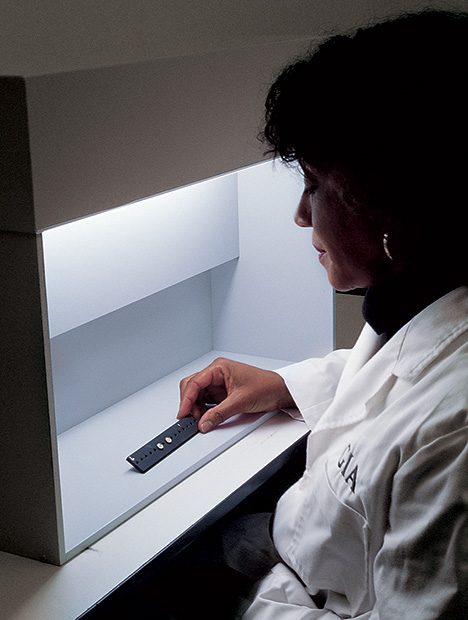
brightness, fire, and overall cut appearance of a polished diamond. This CVE contains
daylight-equivalent fluorescent lighting (to best display brightness) combined with the spot
lighting of LEDs (to best display fire) in a neutral gray environment. Photo by Maha Tannous.
We also investigated the effects of background color (that is, the color in front of which diamonds were observed). Our computer models for brightness and fire assumed a black background; yet we found that most people in the diamond trade use white backgrounds of various types (often a folded white business card) to assess diamond appearance. Our observation teams assessed diamonds for brightness and fire on black, white, and gray traysto determine if tray color affected brightness and fire results. Additionally, the members of our Overall observation team observed diamonds on various color trays to determine their effect on overall cut appearance.
| BOX A: STATISTICAL EVALUATION OF BRIGHTNESS AND FIRE METRICS |
|
We collected relative brightness and fire observations on diamonds in many environments, and we examined a number of possible brightness and fire metrics. To compare metric values with observation results, we had to convert both into rank orders. Members of the Brightness and Fire teams compared each of the Research Diamonds to each other in pairs for brightness or fire, respectively; this gave 990 binary comparisons under each condition. As is typical with observation data, not all observers agreed on every result (although some results were unanimous). This makes sense if the relative ranking of two diamonds is not considered simply as a measurement, but as a measurement with some accompanying uncertainty; that is, a distribution of values. (For example, 4 is always a larger number than 3 which is a larger number than 2; but a number measured as 3 ± 1.2 could in fact be greater than 4 or less than 2.) We therefore assumed that the observed brightness (or fire) rank for each diamond could be represented by a probability distribution, and then found the relative order that maximized the probability of obtaining the observational data we had. Sometimes, the data showed that all observers saw one diamond to be better (or worse) than all the others. In such a case, all the pair-wise comparisons to that diamond were set aside from the rest of the data set; this process was repeated, if necessary, to determine the relative order of the remaining diamonds, fromwhich overall rankings could then bemade. For both observed ranks (described above) and metric ranks (based on their metric values), we used scaled rank orders (i.e., the orders did not have to be an integer value, but the highest-ranking diamond came in first, and the lowest-ranking diamond came in 45th). The scaled-rank data sets were compared using the Pearson Product Moment Correlation. This method produces the “r”-value seen in linear correlations (see, e.g., Kiess, 1996; Lane, 2003). The metric with the highest r-value to the observed data was selected as the best fittingmetric. We then used Cronbach’s alpha (see, e.g., Cronbach, 1951; Nunnally, 1994; Yu, 1998, 2001) to test the reliability of the metric predictions relative to our observers. Cronbach alpha values range between 0 and 1, with near-zero values representing noncorrelated sets of data. Values of 0.70 and higher are considered acceptable correlations for reliability. More importantly, if results from a predictive system are added to a dataset as an additional observer and the alpha coefficient remains about the same, then that system is strongly correlated to (i.e., is equally reliable as) the observers. |
For the Brightness and Fire teams, additional viewing devices were sometimes employed, especially in the early stages of investigation. To test our axially symmetric (that is, hemisphere-like) brightness metrics, we built patterned hemispheres (figure 7; also, see table 1 in the Gems & Gemology Data Depository at www.gia.edu/gemsandgemology) of various sizes (6, 12, and 16 inches—about 15, 30, and 41 cm—in diameter) in which the diamonds were placed while observers evaluated their relative brightness. The results of these hemisphere observations were also compared to results from the more typical trade environments discussed above (table 4, “Brightness: verification;” see also box A). To be rigorous in our investigation, we examined a wider range of hemispheres than we believed were necessary solely to test our brightness metrics. In addition, we constructed a “fire training station,” an environment consisting of a light source and a long tube (figure 8) that enabled Fire team observers to grow accustomed to seeing finer distinctions of dispersed colors in diamonds, and to distinguish among diamonds with different amounts of fire. Once they were comfortable with the fire training station, observers made evaluations of fire in our retail-equivalent lighting (described above) and, eventually, in our CVE (table 4, “Fire: verification”).
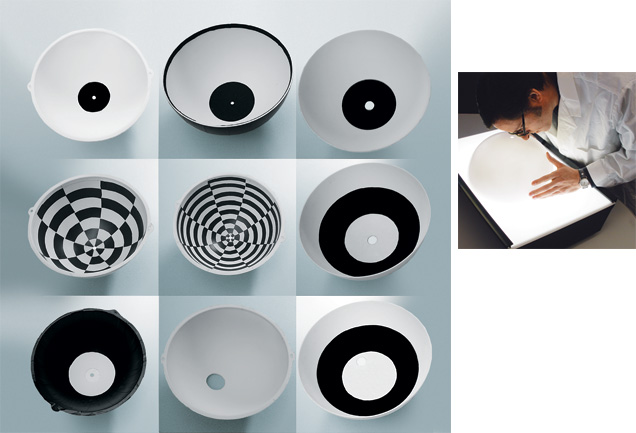
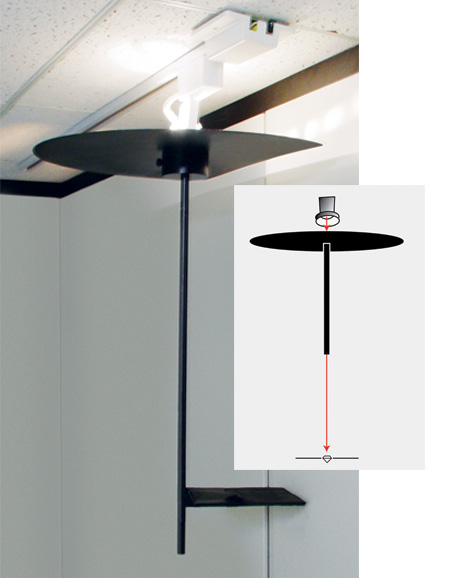
differences in fire in polished diamonds. Inset: In this schematic diagram,
spot incandescent lighting fromabove is blocked and channeled into a
long tube that shines a narrow beamof directed light onto a polished
diamond. Photo by A. Gilbertson.
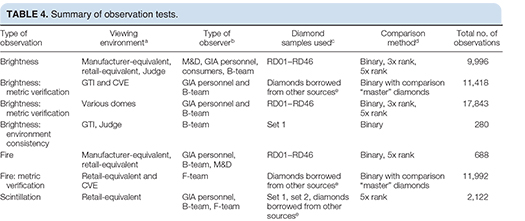
Early Observation Testing: Brightness and Fire. Our Brightness team examined a set of five Research Diamonds, RD01–RD05 (see table 1), for brightness differences in the dome environments described above. We confirmed that the predictions of a specific brightness metric (the relative brightness order of the five diamonds) matched the observations of the Brightness team in the environment for that metric. We then used relative observations of 990 pairs of Research Diamonds (our core reference set; see table 1 and box A) in dealer-equivalent lighting to select the appropriate brightness metric; that is, we adjusted the modeling conditions (e.g., lighting conditions or viewing geometry) of our brightness metrics until we found one that predicted brightness ranking in the same order as the observation results.
Next, we trained the Fire team to see relative amounts of fire consistently and asked them to compare the same 990 pairs of diamonds in a retailequivalent environment that emphasized this appearance aspect. Then, as we did with the brightness metric, we varied the modeling conditions (in this case, the threshold levels of discernment) of the Reinitz et al. (2001) fire metric to get the best fit with these observations in this environment.
As part of this early testing process, we also chose almost 700 diamonds with varying quality characteristics (i.e., with a wide range of clarity, color, symmetry, polish, fluorescence, etc.) and had both our Brightness and Fire teams observe them for brightness and fire in the dealer- and retail-equivalent environments.We compared these observations to brightness and fire metric results to determine whether any of these characteristics significantly affected the correlation between observation results andmetric results.
Later Observation Testing: Overall Cut Appearance and Quality. We used several methodologies for observation testing of overall cut appearance and quality. One method was to ask observers to look at five diamonds at a time and rank them from brightest, most fiery, and/or best looking to least bright, least fiery, and/or worst looking (we also did this using three diamonds at a time).We conducted later comparisons in a “binary” fashion (that is, comparing two diamonds at a time from a set, until each diamond had been compared to every other diamond in the set).We also conducted observations in which diamonds were compared against a small suite of Research Diamonds chosen from the core reference set. A fourth methodology consisted of asking observers to examine larger sets (10 to 24 diamonds) and order them by overall appearance into as many groups as they wished (for a summary of all observation tests, again see table 4).
In early sessions, participants were asked to observe diamonds face-up, without a loupe, while the diamonds were in the observation tray. However, we did not restrict their ability to move or tilt the diamonds, and in most cases participants tilted or “rocked” them during their examination. Later, when we conducted observations on overall cut quality (as opposed to just face-up appearance), we allowed participants to examine the profiles of the diamonds (using a loupe and tweezers) after they had provided their first impressions of the diamonds. This process further helped us recognize the importance of craftsmanship and other factors in the assessment of overall cut quality.
In all of these observations, participants were asked to rate diamonds based solely on face-up appearance or on each diamond’s overall cut quality. Participants were also asked to detail the reasons for their decisions (e.g., localized darkness in the face-up appearance or girdles that were “too thick”). These responses along with the participants’ rankings were then used to develop a methodology for accurately predicting a diamond’s overall cut appearance and quality.
Computer Modeling and Calculations. Our computational methods for the modeling of brightness and fire were essentially the same as those given in our two previous papers (Hemphill et al., 1998; Reinitz et al., 2001). Although our modeling software is custom and proprietary, it can be used on any computer that can run programs written in the C language; to calculate the metric results for almost one million proportion combinations, we ran them on sixteen 500 MHz Pentium III processors (later updated to sixteen 2.5 GHz Pentium IV processors) and two 2.4 GHz PentiumIV processors.
Metrics. We generated more than 75 different, yet related, brightness and fire metrics to compare with our ongoing observations (see table 2 in the Gems & Gemology Data Depository at www.gia.edu/gemsandgemology). To define an appearance metric, assumptions must be made about the modeled diamond, the modeled observer (position and angular spread of observation), the modeled environment (including illumination), and the property being quantified.
In the metrics for this work (compared to those presented in our two previous G&G articles), we varied:
- The position of the observer and the angular spread of observation for brightness.
- The distribution of dark and light in the environment for brightness.
- The absence or presence of front-surface reflections (specular reflection, or “glare”) for brightness.
- The visual threshold for fire. (This was an explicitly variable factor in our fire metric; again, see Reinitz et al., 2001.)
As before, the proportions of the modeled diamonds were the input parameters that determined the metric values, so the proportion sets could vary without changing the fundamental nature of the metrics. Also as in our earlier articles, the computer- modeled diamonds were colorless, nonfluorescent, inclusion-free, and perfectly polished. Although at first we assumed the diamonds were completely symmetrical, later we measured all the facets on certain diamonds to input their exact shapes intometric calculations.
Comparison of the observation results with the metrics proved to be quite challenging, and details of some of the statisticalmethods we used are given in box A. These tools enabled us to decide which of our metrics were the most appropriate to predict levels of brightness and fire (i.e., the calculated appearance values that best matched results from observers looking at actual diamonds in realistic environments).
Our new metrics were based on the previously published WLR and DCLR metrics and then further developed by varying observer and environmental conditions, and the effect of glare, until we found sets of conditions that best fit the observation data in dealer- and retail-equivalent environments. The Hemphill et al. (1998) WLR (weighted light return) metric for brilliance and the Reinitz et al. (2001) DCLR (dispersed colored light return) metric for fire both assume a distributed observer who is positioned over the entire hemisphere, above the diamond, infinitely far away. The weighting for each possible angle of observation is determined by an angular relationship to the zenith of the hemisphere. (The zenith, looking straight down on the table of the diamond, is weighted the strongest in the final result; this is like someone who rocks the diamond, but allows the table-up view to create the strongest impression.)
To obtain stronger correlations with our diamond observation results, this time we also modeled a localized observer. This virtual observer only detected light from the diamond from a face-up position and within a narrow—3° angular spread— area (like a person who looks at a diamond from a mostly fixed position and from a reasonably close distance, in this case about 14–20 inches—roughly 35–50 cm—as we noted inmost trade observations). Although the published WLR observer did not detect light reflected directly from the upper surfaces (that is, glare, or luster), for this work we considered brightness metrics both with and without glare. As for previous metrics, we assumed our observer had normal color vision.
Another factor to consider when modeling an observer for fire is the visual threshold at which an individual can readily detect colored light. In our previous research (Reinitz et al., 2001), we determined visual thresholds by using a hemisphere on which chromatic flares from the crown of a polished diamond were reflected. With this hemisphere, we concluded that about 3,000 levels of intensity of the colored light could be observed. In the course of our observation tests for fire discernment, we found that an individual could observe more levels of intensity with this hemisphere than when observing fire directly from the crown of a polished diamond. Thus, for the present work we varied this threshold in our metric until we found the best fit with observation results.
The environment for the WLR metric was assumed to be a hemisphere of uniform (that is, fully diffused) illumination above the diamond’s girdle (everything below the diamond’s girdle is dark). By contrast, for the present work we were trying to model environments and lighting conditions used in the trade to buy or sell diamonds. Real-life environments for observing brightness are considerably more complicated. For example, light around a diamond often is disrupted by objects in the room, and much of the light directly over a diamond’s table is reflected off the observer (again, see figure 4). We modeled hemispheres with various patterns of light and dark (again, see figure 7) until we found a modeled environment that closely correlated with the brightness results from typical trade environments.
The environment for the DCLR metric was a uniformly dark hemisphere (again, above the diamond’s girdle, with all space below the girdle plane also dark) with parallel rays of illumination coming from a point light source, centered over the table. This is a reasonable approximation of a single spot light (for an observer who is not blocking the light source, and who is rocking the diamond a lot) or of many, arbitrarily placed spot lights, including one above the diamond, for an observer who rocks the diamond only a little. For our current research, we adjusted the visual discernment thresholds within the metric to improve correlation with actual observations of fire in retail-equivalent lighting and viewing environments. This change in metric thresholds was the only one needed to create a new fire metric that correlated well with fire observations.
Finally, the property being quantified by WLR (and our new brightness metric, discussed below) was the total amount of white light returned to the observer fromthe crown of the diamond (in the case of the new brightness metric, this includes glare); for DCLR, it was the amount of dispersed colored light (i.e., fire) returned to the observer (see table 5 for a summary of thesemodel conditions).
| TABLE 5. Comparison of old and new model conditions for calculating brightness and fire. | |||||
| Property | Metric | Modeled observer | Modeled environment | Other factors | |
| Brightness | Old | Spread over 180°above diamond and "weighted" | White hemisphere | no glare | |
| New | Localized 3° angular spread | Dark circle with radius of 23° around zenith | Glare included | ||
| Fire | Old | Spread over 180° above diamond and "weighted" | Dark hemisphere | Large threshold—3,000 brightness levels | |
| New | Spread over 180° above diamond and "weighted" | Dark hemisphere | Small threshold—18 brightness levels | ||
Calculations Derived from Standard Proportion Parameters. From the eight proportion parameters describing a perfectly symmetrical round brilliant cut diamond with a faceted girdle (i.e., table size, crown angle, pavilion angle, star facet length, lowergirdle facet length, girdle thickness, culet size, and number of girdle facets; again, see figure 2), it is possible to calculate other proportions and interrelationships. These include not only commonly quoted proportions such as crown height, pavilion depth, and total depth, but also, for example:
- Facet geometry (e.g., facet surface areas and interfacet angles)
- Extent of girdle reflection in the table when the diamond is viewed face-up (i.e., if too extensive, a “fisheye” effect)
- Extent of table reflection when viewed face-up
- Several parameters related to localized darkness in the crown when viewed face-up
- Weight-to-diameter ratio
We ran such calculations for all the Research Diamonds and for most of the diamonds in table 2; these were used to explore scintillation aspects (see below) and other factors related to the physical shape (e.g., weight concerns) of the diamonds.
Evaluation of Overall (Face-Up) Cut Appearance. Our initial observation tests revealed that, as we expected, our best brightness and fire metrics were able to predict specific observation results (i.e., brightness and fire), but they were not adequate to predict and evaluate a diamond’s overall cut appearance and quality. An example of this can be seen in figure 9, which displays brightness and fire metric results for 165 randomly selected diamonds evaluated by our Overall observation team for their overall face-up cut appearance. The boundaries on this plot delineate five discernible appearance categories, which were based on observation results for brightness and fire previously obtained for the Research Diamond set. Of these 165 diamonds, the overall cut appearance for 95 (58%) was accurately predicted using brightness and fire metrics alone. In addition, all the diamonds were within one category of the predicted result based only on a combination of calculated brightness and fire results.
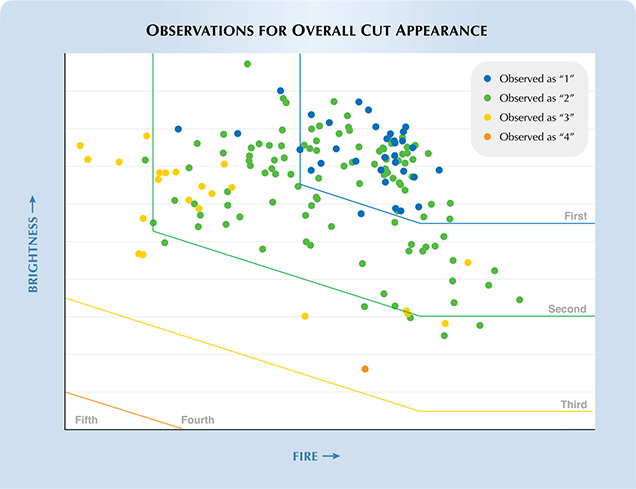
Obviously, additional factors played a significant role in the observation results for the remaining 42% of these diamonds. Hence, the next stage of our investigation concerned how to identify and correctly evaluate those diamonds for which the brightness and fire metric results alone did not accurately predict overall cut appearance, without affecting the results for diamonds already adequately “predicted.”
With this in mind, we looked at comments provided by trade observers and the Overall observation team on the visual appearance of every diamond they examined. In many cases, these comments supported the metric results (for example, that a diamond was dark overall). In other cases, the observers’ comments described appearance effects that caused the diamond to look worse than expected on the basis of brightness and fire alone. When we studied these additional appearance factors, we recognized them as various aspects of scintillation (see box B).
| BOX B: SCINTILLATION |
|
In recent history, scintillation has been defined as the “flashes of white light reflected from a polished diamond, seen when either the diamond, the light source, or the observer moves” (see, e.g., GIA Diamond Dictionary, 1993, p. 200). This was widely recognized as the third essential appearance aspect that worked with brightness and fire to create the overall face-up appearance of a diamond. However, we found through our interaction with members of the diamond trade and our overall observation tests that scintillation encompasses more than just this flashing of light. When asked about the face-up appearance of the diamonds they were observing, many trade members also mentioned the importance of the distribution of bright and dark areas seen in the crown of a diamond. Differences in this distribution, especially changes brought on when the diamond moves, were seen to underlie and influence the flashes of light described in the above definition of scintillation. Thus, given the interdependence of flashing light and distribution, we decided to use two terms to represent these different aspects of scintillation. Sparkle describes the spots of light seen in a polished diamond when viewed face-up that flash as the diamond, observer, or light source moves. Pattern is the relative size, arrangement, and contrast of bright and dark areas that result from internal and external reflections seen in a polished diamond when viewed face-up while that diamond is still or moving. As such, patterns can be seen as positive (balanced and cohesive patterns; see figure B-1) or negative (e.g., fisheyes, dark centers, or irregular patterns; see figure B-2). 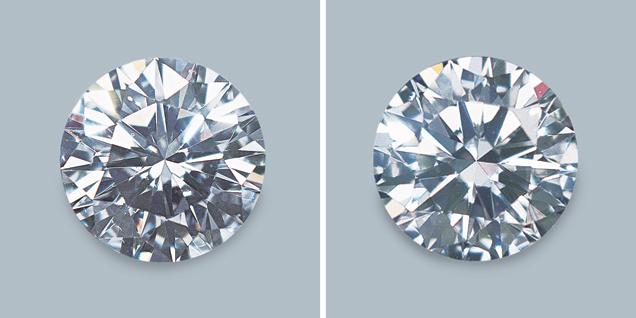
Figure B-1. These diamonds are, in general, viewed positively by experienced members of the diamond trade, due to the overall balance of their patterns and the lack of any negative pattern- related traits. Photos by A. Gilbertson and B. Green.
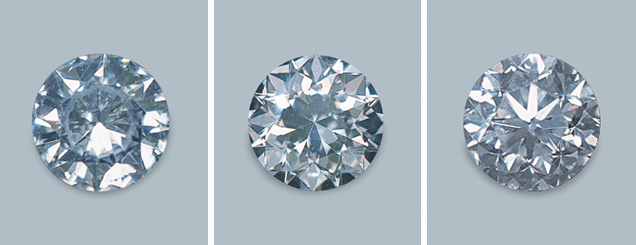
Figure B-2. These diamonds are viewed negatively by experienced members of the diamond trade, due to a variety of unattractive pattern-related traits such as a fisheye (left), dark upper-girdle facets (center), and a busy, broken overall pattern (right). Photos by A. Gilbertson and B. Green.
Many of these pattern-related aspects of scintillation are already taken into consideration by experienced individuals in the diamond trade. Often they were included in the general assessments of diamonds we recorded during observation tests, usually described with terms such as dark spots or dead centers, in addition to fisheyes. Our main finding was that pattern-related effects were often used to describe why a diamond did not perform as well as it otherwise should based on its brightness and fire.Many sparkle-related aspects of scintillation are already included in our brightness and fire metrics. These consist of specular reflections from facet surfaces (now included in the brightness metric) and the dispersed light that exits the crown but has not yet fully separated, so is not seen as separate colors at a realistic observer distance (included in the fire metric). We also found that sparkle was strongly tied to our fire metric, in that those diamonds that displayed high or low fire were found to display high or low sparkle, respectively. Therefore, we concluded that we did not need to address sparkle any further. However, we developed proportionbased limits and pattern calculations to specifically predict and assess the pattern-related aspects of scintillation. |
We used specific comments provided by the Overall observation team and by members of the diamond trade to develop methods of capturing scintillation aspects of overall (face-up) appearance that were not being addressed already by our brightness and firemetrics (again, see box B).We used several rounds of observation tests (listed together in table 4) to create and test a methodology for identifying, quantifying, and categorizing the various effects that indicate deficiencies in scintillation.
Members of our Overall observation team compared “Overall Verification Diamonds” (OVDs; again, see table 2), one at a time, to a suite of appearance comparison diamonds assembled from our Research Diamonds. (Some OVDs were looked at more than once, and some were also observed by the Brightness and Fire teams.) Observations were done in the CVE environment on gray trays (which, at this point, we had determined were most appropriate for assessing cut appearance; see Results). These observers were asked to rank the overall cut appearance of diamonds on a scale of 1 to 5, and to provide specific reasons for the rankings they gave. We used these reasons (which were in the form of descriptions about each diamond’s appearance) to find ways to predict specific pattern-related scintillation aspects that caused a diamond to appear less attractive than expected from our brightness and firemetrics.
This developed into a system for addressing those diamond proportion sets that led to lowerthan- expected appearance rankings (due to patternrelated scintillation). We used proportion-range limits along with proportion-derived calculations to predict specific pattern-related effects.
As we completed each set of observations, we developed and refined our pattern-related methodology, so we could test its efficacy during the next set of observation tests. In this way, we refined proportion- range borders as appropriate, adding new predictive calculations as needed. Thus, we were able to use early test results to address the additional aspects that observers considered (either consciously or unconsciously) while assessing overall cut appearance in later tests. In addition, the tens of thousands of observations we conducted during this process have provided a real-world confirmation of our predictive system, allowing us to feel confident in predicted results, even in cases where we may not have seen a diamond with that specific set of proportions.
RESULTS
Brightness. In early observation experiments, we found that the WLR (weighted light return) metric of Hemphill et al. (1998), although an accurate predictor of a diamond’s brightness when tested in an environment similar to the model, was not as effective at predicting the brightness observations by manufacturers and experienced trade observers in their own environments. Consequently, we developed a new brightness metric that included a more appropriate lighting condition, a more limited observer placement, and an additional observation factor (i.e., glare, the direct reflections off the facet surfaces).
We first confirmed that observations with hemispheres agreed with our predictions of the relative order of the diamonds based on the corresponding brightness metrics. We then used the statistical techniques described in box A to determine which of these metrics gave the best fit to observations of brightness in dealer-equivalent environments (e.g., the GTI, Judge, and CVE). Cronbach alpha values for our brightness testing were determined to be 0.74 for observers alone, and 0.79 for observers plus our brightness metric; the closeness of the two values shows that the brightness metric is at least as reliable as the average observer.
Our final brightness metric assumes a diffused, white hemisphere of light above the girdle plane of the diamond, with a dark circle located at the zenith of this hemisphere (see figure 10). The area below the girdle plane is dark. The total angular spread of observation is 3°, located directly over the center of the diamond’s table. In addition, glare is included in the finalmetric results.
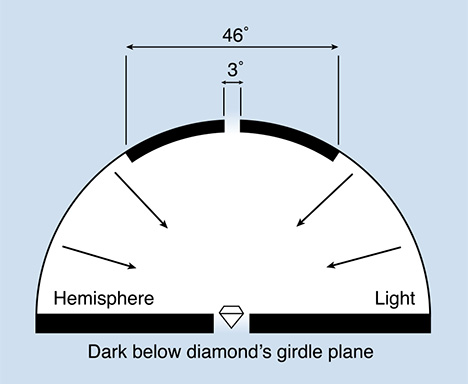
metric. It assumes a diffused, white hemisphere of light above the girdle plane of the
diamond, with a dark circle located at the zenith of this hemisphere that has a radius
formed by a 23° angle from the centered normal of the diamond’s table. The area below
the girdle plane is dark, and the angular spread of observation is 3°, located directly over
the center of the diamond’s table.
Fire. Also as described above, the DCLR (dispersed colored light return) metric of Reinitz et al. (2001) did not correlate well with the collected fire observations in standard lighting and viewing conditions. This is probably because it assumed a greater ability to discern fire than observers demonstrated when they looked at diamonds instead of projected dispersed-light patterns (see Materials and Methods). Therefore, we varied the threshold for readily observable fire to find the best fit. Again using statistical methods mentioned in box A, we found that the best match to the observation data was for a threshold of 101.25, which gives about 18 distinct levels of light intensity for observed fire.
Cronbach alpha values for our fire observations were determined to be 0.72 for observers alone, and 0.75 for observers plus our fire metric; again, the closeness of the two values shows that the fire metric is at least as reliable as the average observer. Since the final fire metric correlated well with the fire observation data, we did not vary any of the othermodel assumptions.
The Effect of Other Diamond Properties and Conditions on Brightness and Fire. Our Brightness and Fire teams evaluated the brightness and fire of 688 diamonds with a range of color, clarity, polish and symmetry grades, girdle condition (bruted, polished, or faceted), and blue fluorescence1 intensity (from none to very strong), as given in the first column of table 2. From these evaluations, we assessed the interaction of these properties or conditions with apparent brightness and fire (by comparing the predicted metric values of these diamonds). We found, as would be expected, that apparent brightness decreases as the color of the diamond becomes more saturated in the GIA D-to-Z range (including browns). Grade-determining clouds in the SI2 and I clarity grades diminish the appearance of fire. Fair or Poor polish causes both apparent brightness and fire to diminish; and Fair or Poor symmetry negatively affects apparent brightness. Neither fluorescence nor girdle condition showed any effect on apparent brightness or fire.
Addressing Overall Cut Appearance. The next step was to compare brightness and fire metric results with observer assessments of overall appearance. For this exercise, we used the experienced observers who comprised our Overall observation team and a set of 937 diamonds borrowed from various sources (a subset of the 1,610 Overall Verification Diamonds). We also conducted observation tests with trade observers using the core reference set of Research Diamonds. Based on tests that placed diamonds into groups, these two observer populations distinguished five overall appearance levels. A number of additional results emerged:
- Differences in body color did not influence the ability of observers to assess overall cut appearance.
- To be ranked highest by the observers, a diamond had to have both high brightness and high fire metric values.
- Not all diamonds with high values for either or bothmetrics achieved the highest rank.
For the subset of 937 Overall Verification Diamonds for which we had measurements, quality information, system predictions, and a detailed set of observations, the observer ranks for about 73% corresponded to the ranks that would be anticipated based on brightness and fire alone; most of the rest were ranked one level lower than would be expected solely based on those two metrics. An additional factor—perhaps more than one—was contributing to overall face-up appearance.
Scintillation. At this point, we did not believe that developing a specific “scintillation metric” was the right approach. (Recall that most of the sparkle aspect of scintillation was already being captured in our metrics for brightness and fire; again, see box B.) Instead, we needed to find a methodology for capturing and predicting the pattern-related effects of scintillation. We accomplished this using a dual system of proportion-based deductions and calculations for specific negative pattern-based features such as fisheyes. (For example, we downgraded diamonds with pavilion angles that were very shallow or very deep because these proportions generally changed the face-up appearance of the diamond in ways that made it less desirable to experienced trade observers.)
Based on the results of the OVD examinations, we found that some overall cut appearance categories were limited to broad, yet well-defined, ranges of proportions. Changes in table size, crown angle, crown height, pavilion angle, star facet length, lower-girdle facet length, culet size, girdle thickness, or total depth could lead to less desirable appearances. Therefore, based on our observation testing, we determined limits for each of these proportions for each of our overall cut quality categories. We also developed calculations to predict pattern-related effects of scintillation (based on proportion combinations) that included the fisheye effect, table reflection size, and localized dark areas in the crown when the diamond is viewed face-up (see examples at the end of the Discussion section). A diamond has to score well on each of these pattern- related factors to achieve a high grade.
Design and Craftsmanship. After speaking with diamond manufacturers and retailers, we verified a number of additional aspects of a diamond’s physical attributes as important: A diamond should not weigh more than its appearance warrants (i.e., diamonds that contain “hidden” weight in their girdles or look significantly smaller when viewed face-up than their carat weights would indicate; figure 11); its proportions should not increase the risk of damage caused by its incorporation into jewelry and everyday wear (i.e., it should not have an extremely thin girdle); and it should demonstrate the care taken in its crafting, as shown by details of its finish (polish and symmetry). Diamonds that displayed lower qualities in these areas would receive a lower overall cut quality grade.
Putting It All Together. Each of these factors (brightness, fire, scintillation, weight ratio, durability, polish, and symmetry) individually can limit the overall cut quality grade, since the lowest grade from any one of them determines the highest overall cut quality grade possible. When taken together, these factors yield a better than 92% agreement between our grading system and Overall observation team results (for comparison, observers in our Overall observation team averaged a 93% agreement). Similar to our brightness and fire metrics, these results confirm that our grading system is as reliable as an average observer. Such high agreement percentages are considered a reliable measure of correlation in the human sciences; this is especially true in those studies influenced by preference (Keren, 1982). We found that many diamonds in the remaining percentage were often “borderline” cases in which they could be observed by our team as a certain grade one day, and as the adjacent grade the next. The difficulties inherent in the assessment of cut for “borderline” samples are similar to those faced in the assessment of other quality characteristics. Observation testing with members of the retail trade and consumers confirmed these findings as well.
Grading Environment. When diamonds are being assessed for overall cut appearance, a standardized environment is essential. Therefore, we developed the GIA common viewing environment, which includes the diffused lighting used by manufacturers and dealers to assess the quality of a diamond’s cut, and the directed lighting used by many retailers, within an enclosed neutral gray viewing booth. Our CVE contains a mix of fluorescent daylightequivalent lamps (to best display brightness) and LEDs (to best display fire). Observation tests and trade interaction confirmed that this environment is useful for consistently discerning differences in overall cut appearance.
After testing with laboratory observers who wore either white or black tops, we determined that observers provided more consistent results for assessing brightness (that is, independent observers were more likely to reach the same results) when they wore a white shirt. Shirt color did not influence fire and overall appearance observations.
During our observation testing with trade members and our Overall observation team, we also found that in many cases background color could affect the ease with which observers distinguished the face-up appearance of one diamond from another. We determined that white trays (which mimic the white folded cards and white display pads often used in the trade) can sometimes cause a diamond to look brighter by hiding or masking areas of light leakage (areas where light is not returned from the diamond because it exits out of the pavilion rather than back to the observer). Alternately, black trays were shown to demonstrate possible areas of light leakage, but in many cases they overemphasized them so the diamond looked too dark. We found that a neutral gray tray (similar in color to the walls of our CVE) was the most appropriate choice for assessing a round brilliant’s overall face-up appearance.
DISCUSSION
Through our research (computer modeling, observation testing, and trade interaction) we found that to be attractive, a diamond should be bright, fiery, sparkling, and have a pleasing overall appearance, especially as can be seen in the pattern of bright and dark areas when viewed face-up.
Aspects of overall face-up appearance seen as positive features include facet reflections of even, balanced size, with sufficient contrast between bright and dark areas of various sizes so that some minimal level of crispness (or sharpness) of the faceting is displayed in the face-up pattern. There are also appearance aspects that are considered negative traits: For example, a diamond should not display a fisheye or large dark areas in its pattern.
In the same manner, we recognized that more than just face-up attractiveness should be incorporated into evaluating overall diamond cut quality. Quality in design and craftsmanship (as evidenced by a diamond’s weight ratio, durability, polish, and symmetry), even if face-up appearance is barely affected, also should be evident in a diamond’s fashioning.
Overall Cut Grade: Components of the GIA Diamond Cut Grading System. Seven components (brightness, fire, scintillation, weight ratio, durability, polish, and symmetry) are considered together to arrive at an overall cut grade in our system. These seven components are considered equally in the system, as the lowest result from any one component determines the final overall cut grade (e.g., a diamond that scores in the highest category for all components except durability, in which it scores in the second highest category, would only receive the second highest overall cut grade; see the pull-out chart for examples). Using this approach ensures that each diamond’s overall cut grade reflects all critical factors, including aspects of face-up appearance, design, and craftsmanship.
In practice, the GIA diamond cut grading system [patent pending] operates by first establishing the diamond’s light-performance potential through metric calculations of brightness and fire (i.e., the best grade possible considering the combination of average proportions and how well they work together to return white and colored light to the observer). That potential is then limited by pattern-, design-, and craftsmanship-related determinations based on calculations, proportion-range limits, and polish and symmetry, so that the grade takes into account any detrimental effects. These determinations work together with the brightness and fire metrics as a system of checks and balances; the cut grade of a diamond cannot be predicted by either the metric calculations or any of the other components alone.
We found through our observation tests that most experienced individuals can consistently discern five levels of overall cut appearance and quality. Thus, the GIA diamond cut grading system is composed of five overall grade categories.
Design and Craftsmanship. “Over-weight” diamonds are those with proportions that cause the diamond, when viewed face-up, to appear much smaller in diameter than its carat weight would indicate. Consider, for example, a 1 ct diamond that has proportions such that its diameter is roughly 6.5–6.6 mm; this diamond will have the face-up appearance of a relatively typical 1 ct round brilliant. A comparable 1 ct diamond with a diameter of, for example, only 5.7 mm should sell for less. A person who contemplates buying one of these diamonds might believe that the latter was a “bargain” (since both diamonds weigh 1 ct, but the latter costs less). However, that person would end up with a diamond that appeared smaller when viewed face-up because much of the weight would be “hidden” in the overall depth of the diamond. Such diamonds are described in the trade as “thick” or “heavy.” A similar difference in value would apply if two diamonds had roughly the same diameter but one weighed significantly more (again, see figure 11).
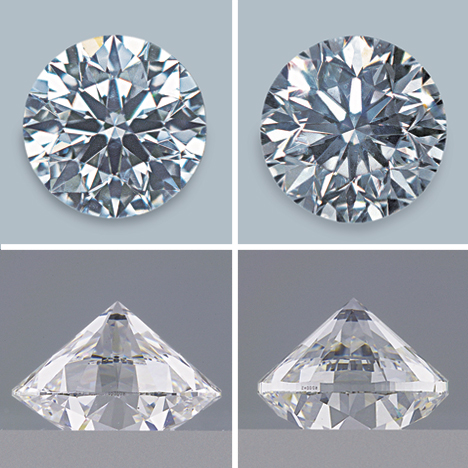
However, the diamond on the right contains extra, or “hidden,” weight located in the
thickness of the girdle. The diamond on the left weighs 0.61 ct, while the diamond on the
right weighs 0.71 ct. Photos by A. Gilbertson and Maha Tannous.
Often, an assessment of a diamond as overweight can be deduced from the combination of its crown height, pavilion depth, total depth, and/or girdle thickness. We developed a calculation that combines the effects of all these factors into one value (the weight ratio of a diamond). This ratio compares the weight and diameter of a round brilliant to a reference diamond of 1 ct with a 6.55 mm diameter, which would have a fairly standard set of proportions (see the pull-out chart for examples).
Durability is another trait of overall diamond cut quality that was emphasized throughout our interaction with members of the diamond trade. Diamonds fashioned in such a way that they are at greater risk of damage (i.e., those with extremely thin girdles) receive a lower grade in the GIA diamond cut grading system.
Finish (that is, the polish and physical symmetry of a diamond) also affects cut appearance and quality. Much like weight ratio and durability, polish and symmetry were highlighted by trade observers as important indicators of the care and craftsmanship that went into the fashioning of a diamond, and therefore had to be considered in any comprehensive grading system. These are assessed based on standard GIA Gem Laboratory grading methodology, and lower qualities of either can bring the grade of the diamond down (again, see the pull-out chart for examples). Note, however, that unlike other traits, there is not a direct correlation between a finish grade and an overall cut grade (e.g., a diamond with a “Very Good” finish may receive a top cut grade).
Other Diamond Quality Factors. Our observer tests enabled us to examine the effects of other diamond quality factors (e.g., color, clarity, fluorescence, and girdle condition) on overall cut appearance. Although in cases of very low color or clarity, we found some impact on overall appearance, in general observers were able to separate these factors out of their assessments. Therefore, we determined that the GIA diamond cut grading system does not need to take these factors into consideration in its final overall cut quality grades; it applies to all standard round brilliant cut diamonds, with all clarities, and across the D-to-Z color range as graded by the GIA GemLaboratory.
Optical Symmetry. One aspect of pattern-related scintillation that has gained more attention in recent years is often called “optical symmetry” (see, e.g., Cowing, 2002; Holloway, 2004). Many people in the trade use this term for “branded” diamonds that show near-perfect eight-fold symmetry by displaying eight “arrows” in the face-up position (and typically eight “hearts” table-down) when observed with specially designed viewers. To investigate the possible benefits of optical symmetry, we included several such diamonds in our observation testing. We found that although many (but not all) diamonds with distinct optical symmetry were rated highly by our observers, other diamonds (with very different proportions and, in many cases, no discernible optical symmetry) were ranked just as high. Therefore, both types of diamonds can receive high grades in our system.
Examples from the GIA Diamond Cut Grading System. On the enclosed pull-out chart, we have provided three examples (from our core set of Research Diamonds) for each of five categories in the GIA diamond cut grading system, including their proportions and other grade-determining factors. For the purposes of this article only, categories are listed as “first” through “fifth,” with “first” representing the best; this nomenclature does not in any way reflect future nomenclature of the GIA diamond cut grading system.
In the first category, we see a relatively wide range of proportions. For these three examples, brightness and fire metric values indicated that they could belong in the top category. Also, none of these diamonds were subject to downgrading based on proportion values or calculated patternrelated scintillation problems. Finally, these diamonds all had polish and symmetry grades that were Very Good. These factors combined to create diamonds that would receive the highest grade.
Our research found that the top grade included even broader proportion ranges than are shown in the chart. For example, we have established that diamonds in this category could have crown angles ranging from roughly 32.0° to 36.0° and pavilion angles ranging from40.6° to 41.8°. It is important to note, however, that not all proportions within these ranges guarantee a diamond that would rate a top grade. As we have previously stated, it is not any one proportion, but rather the interrelationship of all proportions, that determines whether a particular diamond will perform well enough to receive a top grade.
By further studying the data in the pull-out chart, one can see various reasons why particular diamonds would receive a lower cut grade in the GIA system. For example, RD07 falls in the second category based on its fire and scintillation, its total depth of 64.1% and crown height of 17.5%, and its weight ratio. This is a good example of a diamond where the proportion values cause lower light performance and a less-than-optimal face-up appearance.
We have found through our research that proportion ranges for the second category are much wider than those considered by other cut grading systems. Likewise, our trade observers were often surprised when they learned the proportions of diamonds they had ranked in this near-top-level category, although they supported our findings. Here, crown angles can range from roughly 27.0° to 38.0°, and pavilion angles can range from roughly 39.8° to 42.4°. Tables also can range from roughly 51% to 65% for this grade category. Once again, it is important to note that not all individual proportions within these ranges guarantee a diamond that would fall into the second category.
RD06 on the pull-out chart falls into the third category in the GIA diamond cut grading system for at least two reasons: It has a crown height of 9.5% and a crown angle of 23.0°. These factors combine in this diamond to produce a shallow crown, which negatively affects overall appearance. In addition, this diamond is downgraded for a lack of contrast in its scintillation and a localized darkness in the crown area (especially in the table), which results from the interaction of the shallow crown with this particular pavilion angle. Therefore, this is a good example of a diamond that scores high on our brightness and fire metrics, yet is down-graded based on individual proportion values that cause undesirable pattern-related scintillation effects.
It is interesting to note that many in the trade would not consider cutting a diamond with a crown angle this shallow. Yet our research has shown that diamonds with these proportions score in the middle category overall, and might be a very useful alternative for diamond cutters in some circumstances. Typical ranges for this grade category are roughly 23.0° to 39.0° for crown angles, 38.8° to 43.0° for pavilion angles, and 48% to 68% for table sizes.
An example of a diamond that would fall in the fourth category is RD37, which has low brightness and fire metric scores, a table size of 70%, and downgrading for a fisheye that becomes more prominent when the diamond is tilted slightly. Here is another example of a “shallow” diamond, but this one is less attractive because of the fisheye produced by the combination of a large table and a shallow crown height (9.5%) with a pavilion angle of 40.2%.
RD39 is an interesting example of a diamond that would receive the lowest grade. Its brightness and fire metric results—and polish and symmetry grades (each was assessed as Good)—would place it in the second category, and a calculated prediction for localized darkness would place it in the third category. However, it falls into the fifth category in the GIA diamond cut grading system based on its total depth (74.0%) and its weight ratio (which was calculated to be 1.52—that is, 52% more “hidden” weight than a diamond with this diameter should have). Although these proportions may seem extreme, this diamond was purchased in the marketplace. This diamond might be considered better in a less comprehensive system that only accounted for brightness, fire, and finish; however, we believe that this diamond’s overall cut quality (which includes its excess weight) is properly accounted for and appropriately graded in our system.
Please examine the pull-out chart for additional examples of diamonds in the various grade categories.
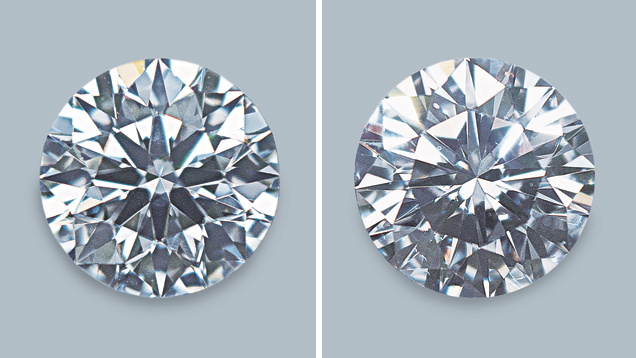
Personal Preferences and Their Effect on Diamond Grading. Although a diamond’s performance is quantifiable, “beauty” remains subjective. (That is, metrics are not subjective but individual taste is.) No cut system can guarantee that everyone will prefer one set of proportions over another; instead, as you move down the cut grade scale, the diamonds in the grade categories change from those that almost everyone likes, to those that only some people might like, to those that no one prefers. A grading system that fails to acknowledge differences in taste is neither practical nor honest in terms of human individuality and preference.
We have found through our research and extensive interaction with the trade that even for diamonds within the same grade, some individuals will prefer one face-up appearance over another (figure 12). Individual preferences have even greater impact in the lower categories. The inherent role of personal preference in diamond assessment will often lead to a situation in which some observers will not agree with the majority; thus, no cut grading system should expect to assess perceived diamond cut quality perfectly for everyone. Instead, what we have tried to accomplish with our grading system is to “capture” within each grade category those diamonds that, in general, most individuals would consider better in appearance and cut quality than diamonds in the next lower category.
CONCLUSIONS
During the 15 years of our research into the relationship of proportions and overall cut quality, we have accomplished a great deal: developed a computer model and created metrics to predict brightness and fire; developed a methodology to validate those metrics and assess other aspects of cut appearance and quality using observation testing; created a common “standardized” viewing environment; and, finally, combined all of these elements to create a comprehensive system for grading the cut appearance and quality of round brilliant diamonds. In the course of this research (including research described in our earlier articles by Hemphill et al., 1998, and Reinitz et al., 2001), we arrived at many conclusions. Among them:
- Proportions need to be considered in an interrelated manner. The combination of proportions is more important than any individual proportion value.
- Attractive diamonds can be manufactured in a wider range of proportions than would be suggested by historical practice or traditional trade perception.
- For consistent comparisons between diamonds, cut grading requires a standardized viewing environment that is representative of common environments used by the trade.
- Personal preference still matters. Diamonds with different appearances can be found within each cut grade, so individuals need to look at the diamond itself, not just its grade, to choose the one they like the best.
Our research and trade interaction also necessitated the further refinement of the terms we use to describe the appearance of a polished diamond when it is viewed face-up. Our definitions of these terms are:
- Brightness—the appearance, or extent, of internal and external reflections of “white” light
- Fire—the appearance, or extent, of light dispersed into spectral colors
- Scintillation—the appearance, or extent, of spots of light that flash as the diamond, observer, or light source moves (sparkle); and the relative size, arrangement, and contrast of bright and dark areas that result frominternal and external reflections seen while that diamond is still or moving (pattern)
The GIA Diamond Cut Grading System. We believe that to best serve the public and the trade, an effective diamond cut grading system should ensure that well-made diamonds receive the recognition they deserve for their design, craftsmanship, and execution. Conversely, it should ensure that diamonds that are not pleasing in appearance, or that warrant a discount for weight or durability reasons, are rated appropriately. In addition, the individual categories in this system should allow for personal and global differences in taste.
Extensive observation testing and trade interaction made it very clear that for a diamond cut grading system to be useful and comprehensive, it had to consider more than just brightness, fire, and scintillation (i.e., more than only face-up appearance). For these reasons, we decided that our system should also include elements of design and craftsmanship (which can be seen in a diamond’s physical shape and finish respectively). Therefore, the GIA diamond cut grading system, which applies to standard round brilliant diamonds on the GIA D-to-Z color scale, encompasses the following seven components: brightness, fire, scintillation, weight ratio, durability, polish, and symmetry.
Brightness and fire, including aspects of sparklerelated scintillation, are assessed using computermodeled calculations that have been refined and validated by human observations. Pattern-related aspects of scintillation are assessed using a combination of determinations based on proportion ranges and calculations developed to predict specific detrimental patterns (both derived fromobservation testing). Weight ratio (which is used to determine whether a diamond is so deep that its face-up diameter is smaller than its carat weight would usually indicate) and durability (in the form of extremely thin girdles that put the diamond at a greater risk of damage) are calculated from the proportions of each diamond. Polish and symmetry are assessed using standard GIA Gem Laboratory methodology. The grading scale for each of these components was validated through human observations; these individual grades are considered equally when determining an overall cut grade.
In summary, our research has led us to conclude that there are many different proportion sets that provide top-grade diamonds, and even wider ranges of proportions that are capable of providing pleasing upper-middle to middle-grade diamonds. Although it is important to consider many components when assessing the overall cut appearance and quality of a round brilliant diamond, an individual’s personal preference cannot be ignored. The GIA cut grading system provides a useful assessment of a diamond’s overall cut quality, but only individuals can say which particular appearance they prefer. With this system of cut grading, the diamond industry and consumers can now use cut along with color, clarity, and carat weight to help them make balanced and informed decisions when assessing and purchasing round brilliant diamonds.
GIA Diamond Cut Grading Reference System. During our research and trade interaction, it became clear that for our grading system to be useful to all levels of the diamond trade (including manufacturers, dealers, retailers, and appraisers), as well as consumers, we needed to provide a method for individuals to predict the cut grade of a polished diamond (even if that diamond was only in the “planning” stage of fashioning) from that diamond’s proportion parameters. To this end, we began the process of developing reference software.
This software [patent pending] will provide a predicted overall cut grade fromproportion values input by the user, with different versions allowing variation of some or all relevant proportions. Final results will be in the form of an estimated overall cut grade by itself (in the basic version of the application) or the estimated overall cut grade presented within a larger grid that would allow a user to explore possible alternative proportion sets that might provide an improved final result. GIA plans to release several versions of this software (as well as a printed version) concurrently with the release of the new cut system.
Next Steps. We plan to incorporate the findings from this research, as well as the foundations and framework of our cut grading system, into future GIA Education courses, GIA Alumni and Research presentations, and Institute informational brochures. In addition, we plan to incorporate some of this information (e.g., expanded proportion data and an overall cut grade) into future GIA Diamond Grading Reports and the GIA Diamond Dossier®. To this end, we are also planning to publish future articles on other aspects of the cut grading system, reference software, and changes to GIA Gem Laboratory grading reports.
Although a primary goal of this research project has been to develop a cut grading system for round brilliant diamonds, there are other benefits that we have gained from this work. Most importantly, this research project has allowed us to create and validate a method of modeling the behavior of light in a polished diamond along with a methodology to verify the findings from that modeling using observation testing by experts in the field. We can now apply these technologies andmethods to other shapes, cutting styles, and colors of diamond to determine whether similar grading systems can be developed. We will continue to identify new goals and questions related to diamond cut as we move forward in our research, beyond the standard round brilliant.
GLOSSARY |
|
Brightness the appearance, or extent, of internal and external reflections of “white” light seen in a polished diamond when viewed face-up. Brightness team the teamof individuals used in observation testing to validate the brightnessmetric. Common viewing environment (CVE) for this study, a neutral gray box with a combination of daylightequivalent fluorescent lamps and overhead white LEDs (light-emitting diodes), used to view the overall cut appearance and quality of diamonds. Computer model a computer program that re-creates the properties and characteristics of an object, along with the key factors in its interaction with specified aspects of its environment. Craftsmanship a description of the care that went into the crafting of a polished diamond, as seen in the finish (polish and symmetry) of a diamond. Design decisions made during the fashioning process that determine a diamond’s physical shape, as seen in a diamond’s proportions, weight ratio, and durability. Durability the characteristic of a polished diamond that accounts for the risk of damage inherent in its proportions (i.e., the risk of chipping in a diamond with an extremely thin girdle). Face-up appearance the sum appearance (brightness, fire, and scintillation) of a polished diamond when it is viewed in the table-up position. This appearance includes what is seen when the diamond is “rocked” or “tilted.” Fire the appearance, or extent, of light dispersed into spectral colors seen in a polished diamond when viewed face-up. Fire team the team of individuals used during observation testing to validate the firemetric. Metric a calculated numerical result obtained through computer modeling; for the GIA diamond cut research project, metrics were calculated for brightness and fire for both hypothetical and actual diamonds. Overall cut appearance and quality a description of a polished diamond that includes the face-up appearance, design, and craftsmanship of that diamond. Overall observation team the team of six individuals (who combined had over 100 years of diamond experience) used during observation testing to discover additional aspects related to face-up appearance, as well as to validate the predictions of the GIA cut grading system. Overall Verification Diamonds diamonds used in this study to validate the predictive accuracy of the GIA diamond cut grading system. Each of these diamonds was observed for its overall cut appearance and quality by the members of the Overall observation team. Research (reference) Diamonds (RD) the core set of 45 polished diamonds (which represented a wide range of proportion combinations) that were purchased and/or manufactured to be used as a consistently available sample group during the course of the diamond cut study. Scintillation the appearance, or extent, of spots of light seen in a polished diamond when it is viewed face-up that flash as the diamond, observer, or light source moves (sparkle); and the relative size, arrangement, and contrast of bright and dark areas that result from internal and external reflections seen in a polished diamond when viewed face-up while that diamond is still or moving (pattern). Weight ratio a description of a diamond’s overall weight in relation to its diameter. |
DATA DEPOSITORY
Acknowledgments
Table 1: Summary of Viewing Hemispheres Developed During Research of the Brightness Metric
Table 2: Summary of Brightness and Fire Metrics
Submitted by Barak Green
October 7, 2004
.jpg)


