The Shape of Ekanite
ABSTRACT
Despite its high thorium content, and consequent radioactivity, ekanite is still commonly traded in the Sri Lankan gem market. Gem-quality ekanite is derived from several gravel deposits in the country. However, rough specimens do not show rounded shapes that would be expected for stones transported by water; rather, they have remarkably uneven surfaces with multitudes of hollows, bumps, and cavities. Only after the recent discovery of ekanite in its host calc-silicate rock near Ampegama, Southern Province, can the striking shapes be understood. Fluid-driven alteration of ekanite, still inside the host rock, results in the formation of banded nodules with heterogeneous disintegration rims of an earthy consistency. These rims are readily removed by weathering, whereas the interior remnant consisting of chemically and physically resistant, unaltered ekanite persists.

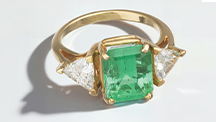
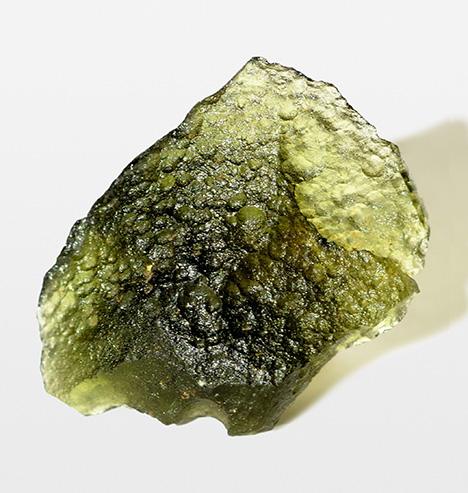
In secondary gem deposits in Sri Lanka, ekanite is a rare mineral, but when found, it frequently occurs with gem characteristics. Rough pebbles have remarkable outer shapes that show concave dents and hollows (figure 1). Apart from its shape, the gemological properties of ekanite resemble those of the borosilicate kornerupine. The most highly valued stones from Sri Lankan deposits are clear, transparent, and show a vivid yellowish green that is reminiscent of the tender leaves of banana plants (figure 2). Most ekanite specimens are rich in inclusions and show a turbid aspect and in some cases four-rayed asterism (Gübelin, 1961). Ekanite (ideally Ca2ThSi8O20) is a phyllosilicate whose thorium content of about 24 wt.%, along with minor uranium, causes harmful radioactivity (Tennakone, 2011) that makes stones unsuitable for setting in daily-worn jewelry, though different assessments seem to exist. Ashbaugh (1988) found that gem ekanite is tens of times more radioactive than “low zircon” stones of comparable weight. Gübelin (1961) came to the conclusion that ekanites could be worn in jewelry without any greater harm, whereas De Silva (2008) mentioned “three reported deaths due to keeping ekanites at close proximity to three gem dealers.” High-quality faceted ekanites are nevertheless highly sought-after collector items, even though prospective buyers should exercise safe handling.
Ekanite is named after its discoverer, Francis Leo Danvil Ekanayake (1898–1971), a Colombo-based customs officer and Fellow of the Gemmological Association of Great Britain. Ekanayake’s contemporaries considered him a capable and painstaking gemologist with a flair for the unusual (Mitchell, 1961), in addition to being well-versed in rare gem minerals (Gübelin, 1961). In 1953, Ekanayake came across two unusual glassy cabochons in the local Colombo gem market that originated from a river-bed gem pit near Ellawala. Immediately he was convinced he had found a new gem species, whereas others considered the material to be devitrified natural or antique glass (Mitchell, 1954). Ekanayake’s conviction was supported by the observation that the material, despite being a glass, contained numerous acicular inclusions having crystallographic orientation (Mitchell, 1961). Investigations continued for more than seven years, until a note describing the new mineral was published (Anderson et al., 1961).
The original ekanite was characterized as metamict by Anderson et al. (1961). The notion of metamict goes back to Brøgger (1893), who used metamikte to describe a class of minerals that show well-shaped crystal forms despite being amorphous. Today, the term is applied irrespective of the outer form to delineate minerals that were initially crystalline but transformed to a glassy state due to internally or externally sourced irradiation over time (Hamberg, 1914; Ewing et al., 1987; Ewing, 1994). It took more than two decades after the initial description until a non-metamict ekanite (tetragonal space group I422) was found in the Tombstone Mountains of Canada’s Yukon Territory (Szymański et al., 1982).

Over the intervening years, ekanite has been discovered in several other localities in Sri Lanka (Dissanayake and Rupasinghe, 1993; Mathavan et al., 2000; Nasdala et al., 2017; Sameera et al., 2020a,b; see figure 3) and other countries (e.g., Demartin et al., 1982; Walstrom and Dunning, 2003; Russo et al., 2013). One remarkable feature of Sri Lankan ekanite is that most specimens, unlike other gems in placer deposits, are not water-worn crystals or rounded pebbles. Rather, the rough material typically shows shapes that—along with the green color—bear a strong resemblance to moldavite-type tektite (see again figure 1; compare to Bouška, 1994; Hyršl, 2015). The underlying causes of the rough surface textures in ekanite are discussed in the present paper, along with an explanation of why attempts by local gem dealers to enhance ekanite by heat treatment invariably fail.
SAMPLES AND EXPERIMENTAL METHODS
The authors have studied ekanite fragments and ekanite-containing specimens of calc-silicate rock we collected in a quarry near Ampegama (for a brief petrological description, see Sameera et al., 2020a), located about 20 km north-northwest of the city of Galle in Southern Province (see again figure 3). Ekanite specimens from Ellawala in Sabaragamuwa Province and Okkampitiya in Uva Province were photographed to illustrate the typical shapes of this mineral in Sri Lankan gem placers. These are the lead author’s samples, purchased from local miners.
Four Ampegama rock samples containing ekanite were impregnated with Araldite epoxy and cut using a diamond saw blade. A polished section and an exposed 25 mm thin section attached to a glass slide were produced from each rock sample. Thin sections were carbon-coated for back-scattered electron (BSE) imaging and electron probe micro-analysis (EPMA), as described below. In addition, double-side polished plane-parallel sections (250 and 1020 μm thickness) were prepared from a separated ekanite fragment. After measuring the refractive index and obtaining optical absorption spectra, the slabs were heat-treated in air (the 250 mm slab at 1400°C and the 1020 μm slab at 750°C) for 48 h. After gentle repolishing, even the (now dull) 250 μm slab was found to be still too thick for optical absorption spectroscopy and therefore thinned to 110 μm thickness. After we obtained another optical absorption spectrum, this slab was embedded in epoxy and subjected to chemo-mechanical repolishing with an alkaline colloidal silica suspension on a polyurethane plate, for the removal of potential near-surface strain. After being coated with carbon, it was subjected to forward-scattered electron (FSE) imaging, as described below.
Specific gravity was determined by weighing three ekanite chips in distilled water and in air. A drop of liquid detergent was added to the distilled water to decrease surface tension. Refraction of the polished slab was measured using a Krüss ER601-LED refractometer equipped with a diode lamp emitting 589 nm light. Both measurements were repeated five times.
Macroscopic luminescence images were taken using a long-wave UV lamp or 385 nm LED illumination. Photomicrographs of thin sections (including optical images in plane-polarized transmitted-light mode and luminescence images in reflected-light mode) were obtained by means of a modified Olympus BX-series microscope equipped with a USH-103OL mercury burner and DP 70 digital camera, using a UV-transmissive XL Fluor 4×/340 objective (numerical aperture 0.28). Here, luminescence images were obtained with a beam splitter and filters in the optical pathway that allowed us to illuminate the sample with UV light (<370 nm wavelength) and to photograph only the sample’s visible emissions (>400 nm wavelength). BSE and FSE images were obtained in an FEI Quanta 3D FEG dual-beam field-emission gun scanning electron microscope (FEG-SEM) operated at 15 kV and 4 nA. The sample tilt was 70°, and the FSE detector position was adjusted to yield predominant orientation contrast. For the basic principles of FSE orientation-contrast imaging, see Prior et al. (1996).
Major-element analyses were done using wavelength-dispersive X-ray spectrometry on a Cameca SX 100 EPMA system operated at 15 kV. The beam current was set to 20 nA for analyzing unaltered (or “fresh”) ekanite and 10 nA for alteration products. The focal-spot diameter of the electron beam was 8–10 μm. The following minerals and synthetic materials were used for calibration (lines analyzed and peak counting times are quoted in parentheses): andalusite (Al-Kα, 20 s), wollastonite (Si-Kα, 20 s; Ca-Kα, 20 s), almandine (Fe-Kα, 20 s), vanadinite (Pb-Mα, 120 s), CaTh(PO4)2 (Th-Mα, 20 s) and UO2 (U-Mβ, 80 s). Background counting times were half of the respective peak counting times. Cameca’s Peaksight software, which is based on the method of Ziebold (1967), was used to calculate detection limits. Matrix correction and data reduction were done using the modified φ(ρz) routine of Merlet (1994). Additional EPMA experimental details are described elsewhere (Breiter et al., 2009; Škoda et al., 2015).
Room-temperature optical absorption spectra were obtained using a Bruker IFS66v/S spectrometer equipped with a mirror-optics IR-scope II microscope and quartz beam splitter. The following combinations of light sources and detectors were used: W lamp and Ge detector (for the spectral range 7500–10000 cm–1), W lamp and Si detector (10000–20000 cm–1), and Xe lamp and GaP detector (20000–26000 cm–1). All optical absorption spectra therefore consist of a combination of three sub-spectra, which were aligned to match in absorbance if necessary. Circular areas 200 μm in diameter were analyzed in transmission geometry.
Room-temperature Raman spectra of inclusions in ekanite were obtained from chips and polished sections, and photoluminescence (PL) spectra of the alteration rims were obtained from thin sections. Analyses were done using a Horiba LabRAM HR Evolution spectrometer. This dispersive system was equipped with an Olympus BX-series optical microscope and a Peltier-cooled, Si-based charge-coupled device detector. Raman spectra of the inclusions in ekanite were excited using a 473 nm diode laser (11 mW at the sample), Raman measurements of the alteration rims were conducted with a 633 nm He-Ne (10 mW) and a 785 nm diode laser (24 mW), and PL was excited using an external, air-cooled 407 nm diode laser (500 mW; unfocused laser beam). The emitted PL and Raman scattered light, respectively, were collected using a 50× objective (numerical aperture 0.50; free working distance 10.6 mm) and dispersed using a diffraction grating with 1800 grooves per millimeter. The spectral resolution was about 1 cm–1. More experimental details are described elsewhere (Zeug et al., 2018).
RESULTS AND DISCUSSION
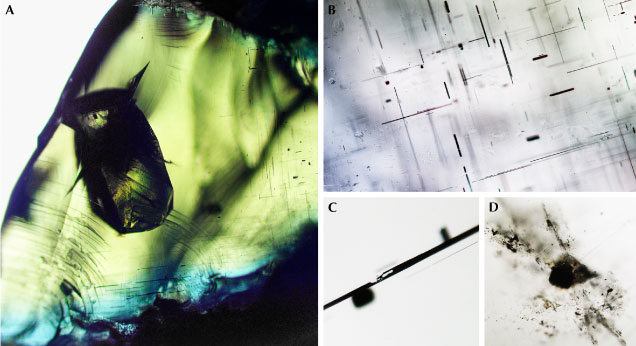
General Characterization. Near Ampegama, ekanite is found as a rare constituent of a calc-silicate metamorphic rock composed primarily of diopside, wollastonite, K-feldspar, and scapolite, occasionally together with minor fluorite and graphite (Sameera et al., 2020a). Ekanite mostly occurs as xenomorphic nodules up to 3 cm in size. Many but not all of them are surrounded by orange to pale brownish alteration rims with an earthy consistency. In fresh conditions, the mineral is vivid olive green to yellowish green. Close to the alteration rims, it may in some cases show discoloration and appear greenish blue (figure 4A). The material is transparent and exhibits conchoidal to uneven fracture. Unaltered ekanite has a vitreous luster and is isotropic. As ekanite is in fact tetragonal, the observed isotropy indicates that the material is present in a metamict (i.e., glassy) state. Its RI was 1.59 ± 0.01, and the SG was determined as 3.27 ± 0.01. Ekanite is apparently non-luminescent under both long-wave and short-wave UV light.

The results of EPMA chemical analyses are summarized in table 1. Ekanite from Ampegama, if unaltered, has a relatively uniform chemical composition that corresponds to the formula Ca2Th0.9U0.1Si8O20 (calculated on the basis of 20 oxygen atoms per formula unit). The composition is fairly similar to that of ekanite from Ellawala (Anderson et al., 1961) and Okkampitiya (Nasdala et al., 2017). To the best of our knowledge, no analysis of ekanite from Rakwana in Sabaragamuwa Province, Passara in Uva Province (both were quoted by Dissanayake and Rupasinghe, 1993), or Makumbura in Southern Province (Sameera et al., 2020b) has been undertaken thus far.
Concordant 206Pb/238U and 207Pb/235U ratios of ekanite from Okkampitiya (Nasdala et al., 2017) indicate that lead is mainly radiogenic and hence was widely excluded during the primary growth of this mineral. Assuming the same is true for the Ampegama ekanite, the measured mean concentrations of thorium (24.2 wt.%), uranium (2.30 wt.%), and lead (0.75 wt.%; converted from the respective oxide concentrations quoted in table 1) are converted to a “chemical age” (Montel et al., 1996; Suzuki and Kato, 2008) of roughly 525 Ma. From this age and present thorium and uranium concentrations, and using the equation of Murakami et al. (1991), a time-integrated self-irradiation dose of 14.0 × 10¹⁹ alpha events per gram of material is calculated. This value exceeds the threshold of Sri Lankan zircon to alpha-event amorphization (Zhang et al., 2000; Nasdala et al., 2002) by about one order of magnitude. It explains the present glassy state of ekanite as resulting from extensive radioactive self-irradiation of initially tetragonal ekanite over long time periods.
This assignment is also supported by microscopic observations. Similar to ekanite from Ellawala (Mitchell, 1961; Gübelin, 1961), the Ampegama ekanite contains numerous acicular fluid and two-phase inclusions that show a crystallographically controlled orientation of needles with the long axes at 90° angles to each other (figure 4, A and B). This is explained by the primary formation of tetragonal ekanite with crystallographically oriented inclusions within the host crystal, followed by irradiation-induced vitrification of ekanite that did not affect the orientations of the inclusions. Some of the needles are filled incompletely (figure 4C). Solid inclusions of irregular shape (figure 4D), determined by Raman spectroscopy, include thorite, quartz and silica glass, K-feldspar, apatite, wollastonite, and calcite.

Optical Absorption and Heat Treatment. Optical absorption spectra obtained from a natural ekanite slab and its heat-treated analogues are presented in figure 5. The green color of natural (metamict) ekanite is due to two main spectral features. First, there is an absorption continuum, tentatively assigned to defect-related “color centers” (see, for instance, Greenidge, 2018), that gradually increases toward the blue–violet–UV range of the electromagnetic spectrum. Second, there is a pronounced absorption band in the red to orange range whose maximum lies near 15700 cm–1 (637 nm wavelength). This band could be assigned to Fe2+ or Fe2+–Fe3+ charge transfer (Smith, 1978; compare to Tennakone, 2011), which appears rather unlikely, however, because of the low iron concentration of 0.18 wt.% (converted from the FeO content of 0.23 wt.% quoted in table 1). Note that Okkampitiya ekanite (see again figure 2) is vivid yellowish green in spite of its even lower iron content of only 0.11 wt.% (Nasdala et al., 2017). Alternative assignments of the red-orange band include the—strongly broadened—analogue of the main U4+ absorption band in zircon (Kempe et al., 2016), or an analogue of defect absorption in diamond (GR1 = neutral carbon vacancy; Clark and Walker, 1973; Nasdala et al., 2013) or zircon (electron-hole defect; Kempe et al., 2016). In the case of the latter, it appears likely that the red-orange absorption band of metamict ekanite is assigned to an oxygen-site vacancy. Clarification of the issue might require synthetic ekanite to be subjected to ion-irradiation experiments.
The green color is explained by the joint effect of a short-wavelength absorption continuum and a red-orange band that bracket a “reduced absorption window” in the green to yellow range, at around 17850 cm–1 (560 nm). The fact that ekanite also transmits well in the long-wavelength range below 15000 cm–1 (above 665 nm) does not significantly affect the coloration, because of the relatively poor sensitivity of the human eye in this spectral range.
Although Sri Lankan ekanite typically has green hues that are quite attractive for gem purposes, local dealers have undertaken several—always ineffective—attempts to enhance its color by heating. Published results on how metamict ekanite responds to heating are decidedly contradictory. According to Anderson et al. (1961), recrystallization of the metamict material to a tetragonal phase with a body-centered unit cell occurs in the range 650–1000°C. This unit cell was later assigned to “true crystalline ekanite” by Szymański et al. (1982). At temperatures above 1000°C, Anderson et al. (1961) observed remelting and formation of huttonite (ThSiO4). In contrast, Zeug et al. (2015) found that ekanite remains glassy and transparent up to 900°C, while the yellowish green color becomes slightly more bluish (see also figure 5, left). Zeug et al. (2015) detected initial nucleation of several poorly ordered phases only at around 1000°C. Between 1100 and 1450°C, crystalline ekanite formed, without any sign of melting. The 1450°C annealing product was identified as ekanite using X-ray powder diffraction and Raman spectroscopy (Nasdala et al., 2017). In agreement with this latter result, heating of Ampegama ekanite to 750°C in the present study did not affect the metamict state, and heating to 1400°C yielded polycrystalline, tetragonal ekanite.
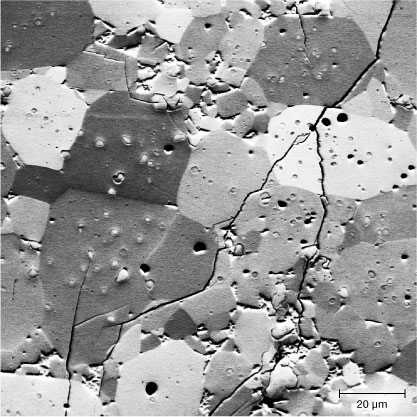
Recrystallized ekanite has an unattractive appearance, as it is brownish green to pale brownish and non-transparent. Mitchell (1961) described it as “putty-colored.” Compared to the transparent metamict starting material, the increase of the absorption continuum toward low wavelengths is depleted, and the total absorbance is about 30–40 times higher (figure 5, right). There are a number of narrow lines we assign to tetravalent uranium, based on their similarity to the absorption of U4+ in zircon (compare to Richman et al., 1967; Mackey et al., 1975). The huge increase in total absorbance, visually recognizable from the loss of transparency, is assigned to the transformation of a glass to a polycrystalline compound. The texture of the annealing product is visualized through FSE imaging (figure 6): The material consists mainly of numerous polygonal, variably oriented ekanite crystals up to 50 mm in size. Minor phases (USiO4, silica, Ca3Si3O9, and others) occur as inclusions inside the ekanite crystals or along grain boundaries. Note that in initial recrystallization stages in a glassy phase, nucleation of other phases may be energetically favored (Capitani et al., 2000). Also, high-temperature heating typically causes loss of the radiogenic lead, which in turn disturbs the initial equilibrium of Th+U+Pb with Ca and Si. Slight deviation of the total composition from that of ekanite necessarily leads to minor formation of other phases (for analogous effects in the annealing of zircon, see Nasdala et al., 2002). Both the presence of nanocrystals of these additional phases and the high number of grain boundaries of fine-grained ekanite aggregates cause loss of transparency and increased absorption. In summary, heating of metamict ekanite below the temperature of spontaneous nucleation (about 1000°C) has minor effects, whereas high-temperature annealing of the material leads to the formation of a dull, polycrystalline compound. The latter is therefore ill-advised in attempting enhancement.
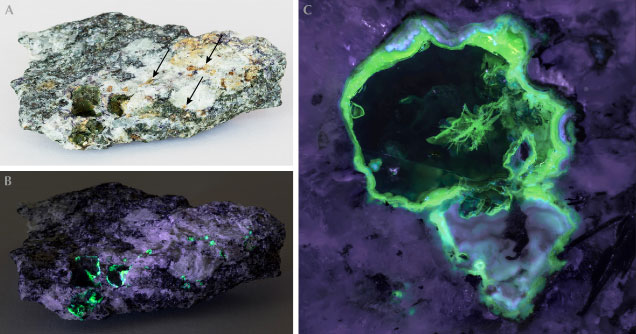
Study of Alteration Products. In the host rock, green ekanite is typically surrounded (or even completely replaced) by yellowish gray to ochre assemblages of secondary phases (figure 7A). These phases are interpreted as products of fluid-driven alteration processes, which is supported by their strongly deficient EPMA totals (table 1). Deficient analytical totals of alteration products may be caused by the presence of light elements that are not analyzed in the EPMA, and they may also be due to their common sub-micrometer porosity (Pointer et al., 1988; Nasdala et al., 2009).
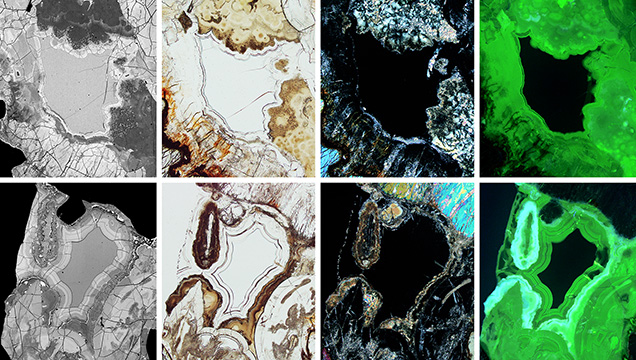
In plane-polarized transmitted light (figure 8), the alteration rims appear heterogeneous, often with a banded texture, and consist of colorless and brownish domains and zones. Compared to unaltered ekanite, the colorless alteration phase is strongly depleted in silicon and calcium, whereas thorium is notably enriched (table 1). The brownish domains show pronounced heterogeneity. Some yield lower and others higher BSE intensity, compared to the neighboring unaltered ekanite (figure 8, far left images). Correspondingly the chemical composition of the brownish domains is decidedly heterogeneous, indicated by large standard deviations from the mean values (table 1). In cross-polarized transmitted light (figure 8), the colorless alteration material does not show any interference color, indicating that it has a glassy structure. The majority of brown regions, in contrast, show low birefringence. In some of the dark brown regions (figure 8, bottom row), aragonite was detected, whereas the identification of all other alteration material using Raman spectroscopy failed, as no evaluable band patterns were obtained. Interestingly, there is no significant lead loss in the alteration products, compared to fresh ekanite. The virtually unvaried presence of lead in the alteration products may indicate either that these phases did not exclude lead upon formation or that alteration occurred soon after ekanite formation, with subsequent transformation of thorium and uranium to lead in the alteration products themselves. Further investigations will be needed to address this issue.

Most of the alteration products show distinct greenish luminescence under UV or violet-blue excitation, while the fresh ekanite appears inert (figures 7 and 8). A representative PL spectrum is presented in figure 9. We assign the broad-band green emission to hexavalent uranium ions that are present in the form of (UO2)2+ (i.e., uranyl) groups. The observation of green, uranyl-related emission is consistent with significant concentrations of uranium and relatively low concentrations of iron in the alteration products (table 1; compare to Gaillou et al., 2008). Only aragonite-containing zones yield even more intense PL (figure 8, far bottom right image); here the green uranyl-related band is overlain by a broad band in the orange-red range whose cause remains unknown.
The PL spectra of many, but not all, uranyl-containing crystalline minerals show a pattern consisting of energetically equidistant bands (Gorobets and Sidorenko, 1974; deNeufville et al., 1981; Wang et al., 2008). Such patterns are also observed from natural opal (Fritsch et al., 2015; Othmane et al., 2016), synthetic glasses (Mahurin et al., 2003), and even uranyl ions and complexes in solutions (McGlynn and Smith, 1961; Moulin et al., 1995). For comparison, we collected the PL spectra of the uranyl-containing species metatobernite, hyalite, and a uranyl glass under the same conditions (figure 9). Thus, the presence or absence of a pattern of equidistant bands does not depend on the host’s crystallinity. Such patterns are assigned to the coupling of electronic transitions with oscillations of the linear O=U=O groups. Energetic differences among neighboring bands depend on the frequencies of uranyl stretching vibrations and hence allow the calculation of U=O bond distances (Jones, 1959). The observation that the studied alteration rims yield non-structured emission is ascribed to an overlay of many vibrational modes, due to extensive irregularity of U=O bonds caused by extensively irregular arrangements of nearest neighbor atoms in the glassy structure.
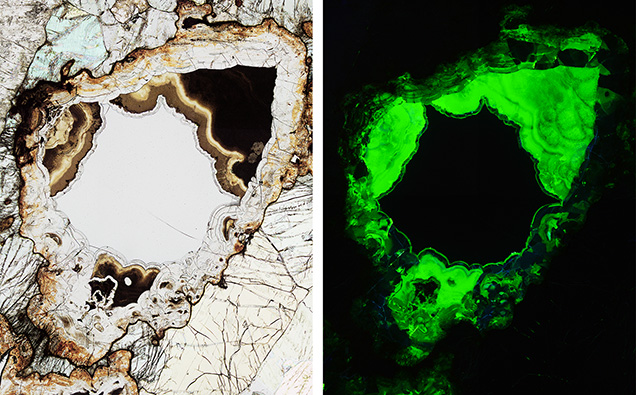
In optical microscopy, the practical benefit of the intense uranyl luminescence of the alteration products is that the shape of the central remnant of fresh ekanite, which does not luminesce, is easily recognized (figure 10). The latter exhibits concave surface features analogous to that of rough ekanite specimens (compare to figure 1). The formation of concave surfaces is therefore explained by the alteration of ekanite in its host rock, whose identity for all secondary deposits remains unknown. Fluid-driven alteration presumably has progressed inward, resulting in concentrically grown reaction rims of secondary phases, at the expense of primary ekanite.
CONCLUSIONS
The physical properties, chemical composition, and general appearance of Ampegama ekanite are broadly similar to ekanite from other Sri Lankan locations, except that the material is not found in a secondary deposit but in situ. In the calc-silicate host rock, fluid-driven chemical alteration decomposes primary ekanite, and the botryoidal growth of alteration products leads to convex surface shapes of the product-phase aggregates, which in turn result in the concave shapes of the ekanite remnant. It is a simple conclusion by analogy that the same may have happened in the (still unknown) host rocks of ekanite found near Ellawala and Okkampitiya. After weathering of the host rock, the soft and earthy alteration products are effectively removed, leaving behind rough ekanite with their dimpled surface patterns. As rough ekanite specimens found near Ellawala and Okkampitiya generally show high degrees of preservation of such surface features, in most cases virtually without abrasion signs, transport pathways from the point of weathering of the host rock to the place of deposition must be short. Consequently, it appears likely that the ekanite is rather eluvial or colluvial.
