How to Calculate Color from Spectra of Uniaxial Gemstones

ABSTRACT
Color is the most important quality for colored stones, one that is widely discussed and studied by gemologists. Understanding the color characteristics of a gemstone can provide a scientific basis to guide its cutting. This study uses visible spectroscopy to determine the unpolarized spectra of a uniaxial material from the polarized spectra (o-ray and e-ray) in order to predict the color of a uniaxial gem material when viewed in any direction. A seemingly intuitive way of doing this, by adding weighted amounts of the o-ray and e-ray absorption spectra, does not actually work for estimating the unpolarized spectra. The mathematically and physically correct way to reconstruct these unpolarized spectra is to add weighted polarized transmittance spectra and then to convert back to absorption if desired. This method allows color to be accurately predicted for a material when viewed in any direction as long as the polarized spectra and the viewing angle relative to the c-axis are known. This method has been verified by comparison with a synthetic V-bearing sapphire and a synthetic Cr-bearing sapphire cut into wafers (not faceted gemstones) at various angles relative to the optic axis.
INTRODUCTION
Most gem materials are minerals with crystal structures exhibiting long-range order, such as diamonds, rubies, and sapphires. In order to fully understand their color behavior, one must consider these gem materials from the perspective of their crystallographic characteristics. All crystals can be divided into three categories: isometric, uniaxial (see figure 1), and biaxial.
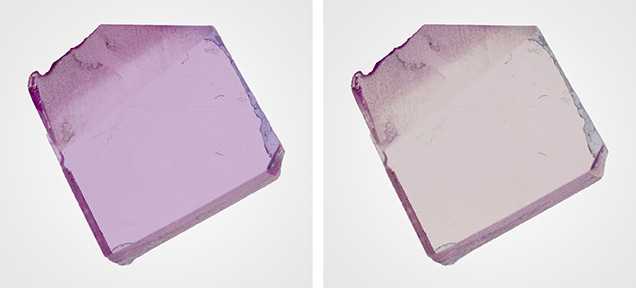
Polarized Light. Light is a form of electromagnetic radiation that can be considered as waves traveling in one direction at the speed of light with electric and magnetic field components vibrating perpendicular to the direction of travel. The colorimetric properties of light that reaches our eyes are determined by the spectrum of wavelengths present in the light beam. In general, white light as produced by the sun or an incandescent bulb is unpolarized, meaning the electric field component has no preferred orientation, with every oscillation direction equally represented. When unpolarized light passes through either a uniaxial or biaxial material in a direction not parallel to the optic axis, it splits into two distinct rays that have electric field oscillation directions perpendicular to each other (Tilley, 2020). This can be seen by observing uniaxial or biaxial crystals with transmitted polarized light, where in most cases we will observe different colors with different orientations (see figure 2). This, in turn, is because most colored uniaxial or biaxial minerals will absorb light differently when the electric field polarization orientation of the light changes.
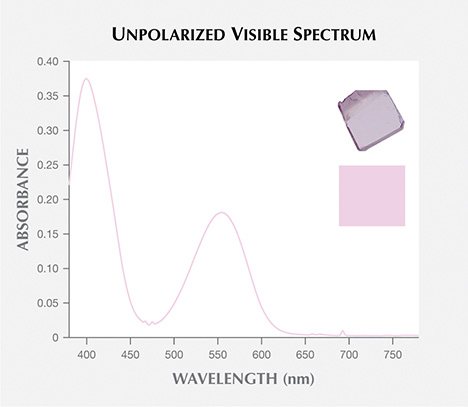
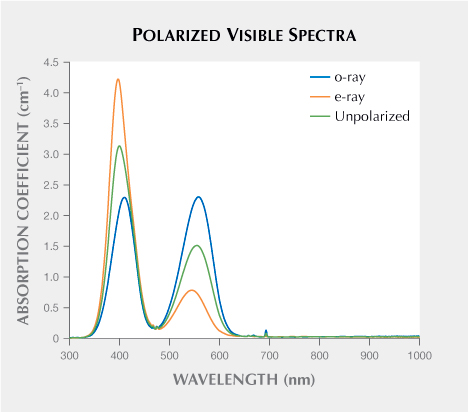
Color from the Spectrum. The perception of color as experienced by human observers is determined by three main factors: lighting condition, the human visual system, and the object itself. Colorimetry is the field of study that deals with quantitative descriptions of color perception. The color stimuli of transparent materials (e.g., gemstones) will depend on which wavelengths of light pass through the material in the visible range (approximately 380–780 nm). Figure 3 illustrates the absorption spectrum of a synthetic pink sapphire that shows which wavelengths of unpolarized light are selectively absorbed by the material (high values of absorbance) and which wavelengths are less absorbed (low absorbance). The term pleochroism is used to describe the phenomenon whereby light with different polarization directions produces distinct colors due to differences in the way polarized light is absorbed by uniaxial or biaxial minerals (Hughes, 2014). For a uniaxial mineral, there are two unique electric field oscillation directions, either perpendicular to the optic axis1 (o-ray) or parallel to the optic axis (e-ray). (Note that in this manuscript, we make use of the o-ray and e-ray terminology, which is equivalent to the E⊥c and E||c terminology more commonly used in the mineralogical literature.) For a uniaxial material such as ruby, the absorption spectrum changes with polarization direction from the o-ray to the e-ray (figure 4).
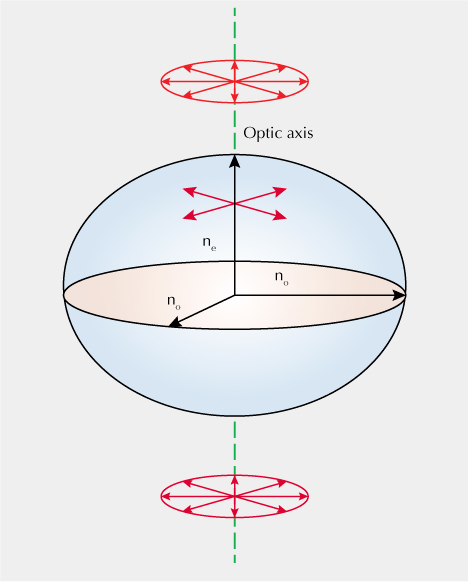
1The optic axis is not a single line, but a direction (Hecht, 2001). From figure 6, the dotted line represents the direction of the optic axis. no represents the o-ray electric field oscillation direction while ne represents the e-ray electric field oscillation direction. Scientific journals also use E||c, which is equal to the e-ray, and E⊥c, which is equal to the o-ray.
The perceived color of light after passing through a polished wafer of any uniaxial material can be calculated using transmittance spectra (both polarized and unpolarized) and the incident light angle relative to the c-axis combined with the spectral power distribution of the original lighting condition (e.g., daylight-equivalent D65 illumination or incandescent illumination), as well as the human vision responsivity functions that describe how the combination of wavelengths reaching the eye are translated into color.
In general, most light sources are unpolarized. Therefore, it is most appropriate to consider any material under unpolarized light when determining the perceived color. For uniaxial minerals, when unpolarized light is transmitted parallel to the optic axis, all of the rays are equivalent o-rays, with their electric field oscillation direction perpendicular to the optic axis. However, when unpolarized light passes through the material perpendicular to the optic axis, it splits into two different rays: an o-ray and an e-ray, vibrating perpendicular and parallel to the optic axis, respectively. When unpolarized light passes through a uniaxial material in any random direction, it will also split into two rays, with one ray constrained to vibrate along the o-ray and the other vibrating perpendicular to both the o-ray oscillation direction and the path of the light ray. Based on the authors’ knowledge, however, the exact means of determining the unpolarized absorption spectrum of a uniaxial mineral in any general direction has never been clearly elucidated. As will be demonstrated in subsequent sections, the intuitive means of mixing the o-ray and e-ray absorption spectra weighted according to the geometry of any general direction is not correct and cannot reproduce experimentally measured spectra. In this contribution, we demonstrate that one must use weighted combinations of o-ray and e-ray transmission spectra in order to determine the absorption spectrum, and hence the color, of a uniaxial mineral for a given input illumination ray angle and viewing angle.
MATERIALS AND METHODS
Samples. The synthetic ruby and sapphire samples were provided by GIA’s Carlsbad research laboratory. All samples were prepared as wafers with an optical-quality finish. The crystal orientation was well controlled by the biaxial crystal orienting device described by Thomas et al. (2014).
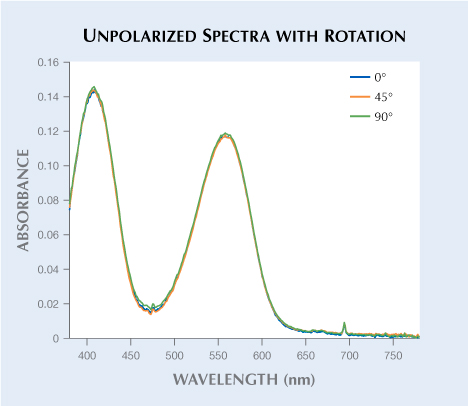
UV-Vis-NIR Spectroscopy. The polarized UV-Vis spectra were collected with a specially modified Hitachi U-2910 spectrophotometer. The spectra were collected in the 190–1100 nm range with 1 nm spectral resolution at a scan speed of 400 nm/min. The unpolarized spectra were collected with a PerkinElmer Lambda 950 UV-Vis spectrophotometer (PE 950) in the 200–1000 nm range, also with 1 nm spectral resolution. We also checked the degree of polarization of the generated unpolarized light from the PE 950. The results showed that the PE 950 can produce ideal unpolarized light (see box A), which means the unpolarized spectra are appropriate for the spectral analysis. Both polarized and unpolarized spectra were collected at GIA’s Carlsbad laboratory.
RESULTS AND DISCUSSION
This research began with an accidental discovery. In 2018, the lead author (CS) worked as a research intern in GIA’s Carlsbad laboratory studying chromophores in corundum. At first, all of the UV-Vis spectra for corundum were collected using the Hitachi U-2910 spectrophotometer, which is set up at GIA only to collect polarized spectra. However, the author also wanted to collect some unpolarized spectra at the same time for the purpose of calculating color seen with unpolarized light. To save time, we came up with a hypothesis that one could recreate the unpolarized absorption spectra of a corundum wafer in a general orientation with weighted versions of the o-ray and e-ray absorption spectra. For example, light traveling perpendicular to the optic axis will split into two orthogonal rays, and the unpolarized spectrum was predicted to be equal to the sum of half of the o-ray absorption spectrum and half of the e-ray absorption spectrum (see equation 1):
Aunpolarized = 0.5 × Ao-ray + 0.5 × Ae-ray (1)In order to verify this hypothesis, the PerkinElmer Lambda 950 UV-Vis spectrophotometer was used for collecting unpolarized spectra of vanadium-bearing sapphire with unpolarized light traveling perpendicular to the optic axis. The vanadium-bearing sapphire had strong pleochroism, which meant there were large differences between the o-ray and e-ray spectra. Therefore, if the predicted and measured spectra were in good agreement, we could conclude that the hypothesis is correct. The measured and predicted spectra (using weighted absorption spectra as in equation 1) are shown in figure 5. Because of the significant difference between the estimated and measured spectra, we determined that this hypothesis is wrong and the unpolarized absorption spectrum cannot be reconstructed from appropriately weighted versions of the o-ray and e-ray absorption spectra.
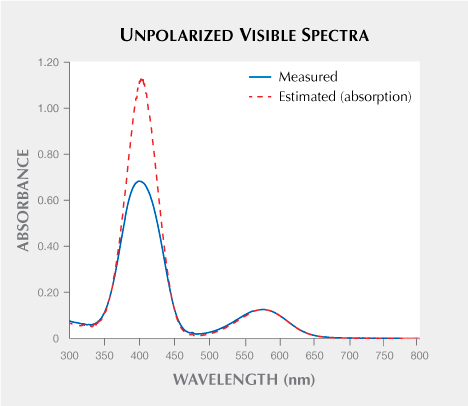
At this point we realized that predicting unpolarized absorption spectra is more complicated than we initially thought. In this research, we explain why we cannot use weighted combinations of o-ray and e-ray absorption spectra to determine the unpolarized absorption spectrum. In addition, we also provide a reasonable method for predicting the absorption spectra in any general orientation. The key to this method is that all the calculations should be based on transmission spectra instead of absorption spectra. This solution can be arrived at intuitively since the addition of two different absorption spectra mathematically requires that all of the light is simultaneously absorbed by both absorption spectra. For instance, if we add together a Cr and V absorption spectrum to represent a Cr- and V-bearing material, the full light is simultaneously absorbed by Cr and V. However, when considering the splitting of light into two polarized rays in a uniaxial material, the two rays of light are independent with each ray being blind to the other. To mathematically model this, it is necessary to convert absorption to transmission to effectively split these two rays of light. See the discussion below.
Unpolarized Light Traveling Parallel to the Optic Axis. In the case of cubic crystals, the refractive indices of the incident light in any polarization direction are identical (Tilley, 2020). However, when dealing with uniaxial crystals, the refractive indices of the o-ray and e-ray are not equal. A beam of light traveling through a uniaxial crystal splits into two orthogonal beams, each with its own refractive index. When light travels parallel to the optic axis, the light will vibrate in all directions perpendicular to the light ray path. Figure 6 demonstrates this with the uniaxial material represented by an ellipsoid defined by the refractive indices of o-ray and e-ray light. The optic axis is vertical in this diagram, and a cross section perpendicular to the optic axis is a circle with a radius equal to the refractive index of the o-ray (no). Therefore, when light passes through a uniaxial material along the optic axis, it vibrates perpendicular to the optic axis.
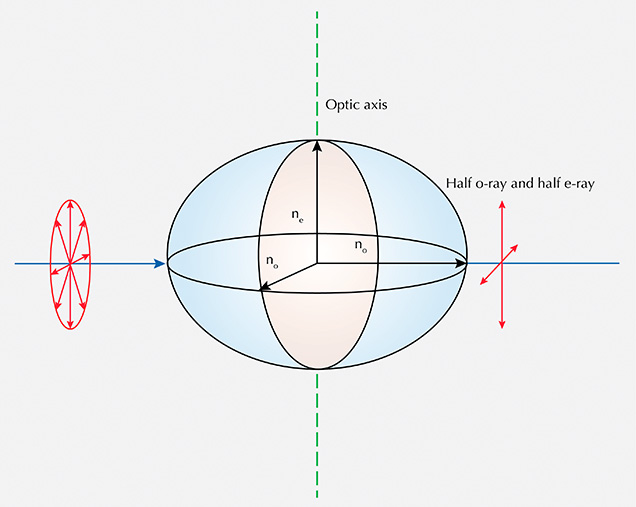
Unpolarized Light Traveling Perpendicular to the Optic Axis. When light travels perpendicular to the optic axis, it will split into two rays with orthogonal electric field directions. In this case, for a uniaxial crystal, the cross section of the indicatrix is an ellipse rather than a circle (figure 7). One of the split rays will have its electric field oscillation direction parallel to the optic axis (an e-ray), while the other ray will vibrate perpendicular to the optic axis (an o-ray). Light traveling in this direction will be equally split into o-ray and e-ray light.
This is best thought of by considering the intensity, or radiant flux, of the incident light being split in half between an o-ray and an e-ray. The relationship between transmittance and radiant flux can be expressed as in equation 2:

where
- T is transmittance
- Φt is the transmitted radiant flux through the material
- Φi is the initial radiant flux received by the material
Because the o-ray and e-ray each receive half of the radiant flux incident on the material, equation 2 could be rewritten as:

where
- Φto-ray is the transmitted radiant flux associated with the o-ray
- Φte-ray is the transmitted radiant flux associated with the e-ray
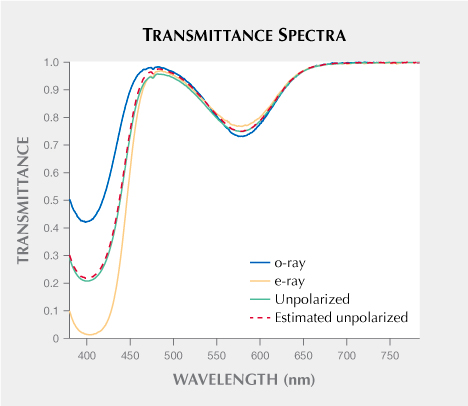
Equation 3 shows mathematically why simply adding absorption spectra as in equation 1 is incorrect, since there is a logarithmic relationship between transmittance and absorbance: A = –log(T). To verify our formula, unpolarized light was used to measure the vanadium-bearing sapphire wafer with faces cut and polished parallel to the optic axis. Next, we compared the measured spectrum with the calculated spectrum based on equation 3 using the measured o-ray and e-ray absorption spectra converted to transmittance. The results are shown in figure 8. We can see from figure 8 that the estimated spectrum agrees well with the measured spectrum. We can also calculate the color from the estimated spectrum and the measured spectrum as well as the spectrum estimated by the method of using weighted absorption spectra (equation 1). These three colors are reproduced in figure 9. The color difference value, ∆E00 (Luo et al., 2001), between the correctly estimated and measured spectra is 0.80, while the ∆E00 between the incorrectly estimated and measured spectra is 1.79, demonstrating the accuracy of using transmittance spectra to predict color.

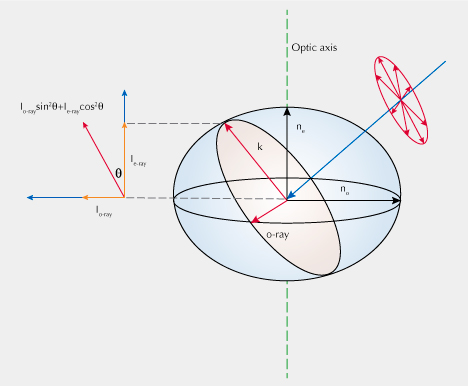
Unpolarized Light Incident in a Random Direction. When considering a beam of light traveling through a uniaxial material in any general direction relative to the c-axis, the situation is slightly more complicated. However, we can still use the framework developed in the previous sections covering samples measured with the polished face parallel and perpendicular to the optic axis using unpolarized light. From the optical indicatrix shown in figure 10, it is obvious that when light traveling through a uniaxial material in a general direction is split into two rays, one of them can be described as the o-ray while the other ray (k) is a mixture of an o-ray and an e-ray. Based on Malus’s law (Collett, 2005), the component of the split light (k) along the o-ray and e-ray polarized directions can be calculated according to equation 4:
Ik = sin2θ× Io + cos2θ × Ie (4)where
- I represents the intensity of light along the specified polarization
- θ is the angle between the cross section (see also figure 10) and the optic axis
Since transmittance is proportional to the light intensity2, equation 4 can be rewritten as equation 5 and the final equation for calculating the unpolarized spectrum in any general direction can be expressed as equation 6:
Tunpolarized(k) = sin2θ × To-ray(k) + cos2θ × Te-ray(k) (5)Tunpolarized = 0.5 × To-ray +0.5 × (sin2θ × To-ray +cos2θ × Te-ray) (6)
When the light travels parallel to the optic axis, θ = 90°, sin2θ = 1, cos2θ = 0, and equation 6 is equal to To-ray. When the light travels perpendicular to the optic axis, θ = 0°, sin2θ = 0, cos2θ = 1, and equation 6 is equal to equation 3.
2The total radiant flux is 4π sr times the radiant or light intensity when dealing with isotropic radiation. Note: sr represents “steradian.”
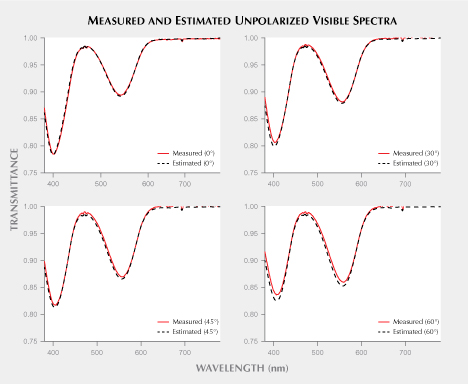
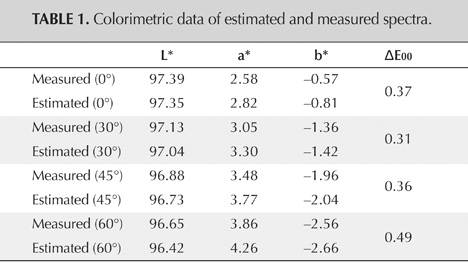
To verify the accuracy of equation 6, the authors selected a high-quality, homogeneous synthetic ruby and cut it into four double-sided polished wafers. These four wafers were accurately oriented using the biaxial crystal orienting device described by Thomas et al. (2014). The angles between the polished faces of the four wafers and the optic axis are 0°, 30°, 45°, and 60°, respectively. Unpolarized spectra were measured for these four samples as well as polarized spectra (o-ray and e-ray) from the 0° sample. The measured spectra and estimated spectra (based on equation 6) are shown in figure 11, illustrating that the estimated spectra agree well with the measured spectra. Therefore, equation 6 can be used to reconstruct the unpolarized spectrum of a sample of a uniaxial material at any known angle relative to the c-axis from the o-ray and e-ray spectra. In addition, the colorimetric data as well as the ∆E00 values are shown in table 1. The very small ∆E00 values for all four tested angles illustrate the high accuracy of the estimated spectra and are similar in magnitude to the expected uncertainty between two measuring instruments. To get a sense of the magnitude of ∆E00 values, the repeatability of an instrument for uniform samples without replacement on a single instrument is on the order of 0.05–0.10, reproducibility of measurements across different times or instruments is on the order of 0.5–1.0, and perceptibility thresholds for color differences are on the order of 1.0–2.0. The precise magnitudes depend on the uniformity of the samples, the specific instrument, the measurement geometry, and viewing conditions such as background, illumination color, and illuminance level (Berns, 2019).
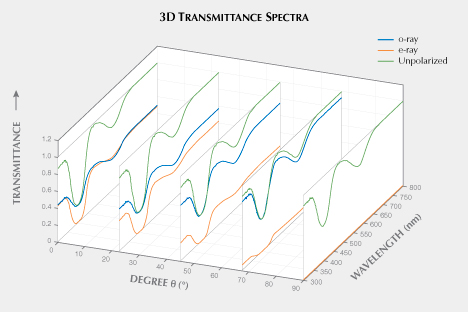
Since the relationships between different angles and unpolarized spectra were directly measured, a 3D plot where the incident angle (θ) is plotted against transmittance spectra (o-ray, e-ray, and unpolarized) to demonstrate the variation of the contribution of each polarized ray (not full transmittance) at various angles is presented in figure 12.
CONCLUSIONS
The unpolarized spectra of uniaxial materials in any direction can be reconstructed from the square of the cosine and sine functions of o-ray and e-ray, provided the incident light angle θ relative to the c-axis (optic axis) is known. This calculated function, expressed in equation 6, was derived theoretically and verified experimentally. The extension of this theoretical framework from polished wafers to faceted gemstones represents a significant challenge and will be the focus of future work.

