Purple Gem Spinel from Vietnam and Afghanistan: Comparison of Trace Element Chemistry, Cause of Color, and Inclusions
ABSTRACT
This study compares two purple gem spinel samples with regard to trace element chemistry and visible light absorption spectra, and presents the first reported example of a spinel with a saturated purple color caused predominantly by chromium and cobalt. Sample VN, from a placer deposit in the Luc Yen district of Vietnam, exhibited strong saturation, orange-red fluorescence in UV, and magnesite and graphite inclusions. Sample AF was from Badakhshan, Afghanistan, with light to medium saturation and containing phlogopite, amphibole, and probable fluid inclusions. UV-Vis-NIR spectra are compared along with trace element chemistry. Sample VN is colored primarily by cobalt (17.9 ppma) and chromium (593 ppma), with minor color contribution from Fe (2437 ppma), and contains significantly more cobalt than typical Cr-enriched red, pink, and purple gem spinels (<6 ppma Co). The dominant contributions of chromophores Cr3+ and Co2+ to the color of sample VN are responsible for its higher color saturation than that of sample AF, which is colored dominantly by Fe2+ and Fe3+ (3089 ppma total Fe) and contains negligible concentrations of other chromophores (<10 ppma V3+, Cr3+, and Co2+). In the Vietnamese purple spinel, the relatively low Fe concentration is likely crucial in creating the attractive saturated color. This sample is enriched in Co, Ni, Cr, V, Zn, and Ga. In contrast, the purple spinel from Afghanistan is relatively impoverished in all trace elements except Fe and Mn. Sample VN represents an approximate intermediate between natural gem spinel populations colored dominantly by Cr3+ vs. dominantly by Co2+. Cr3+-, (Fe2+,Fe3+)-, and Co2+-dominant (in terms of color) gem spinels are easily differentiated by chemical composition using a discrimination plot of Co/Cr vs. Co/Fe, but this is not valid for spinel dominantly colored by V3+ or containing significant concentrations of Fe.
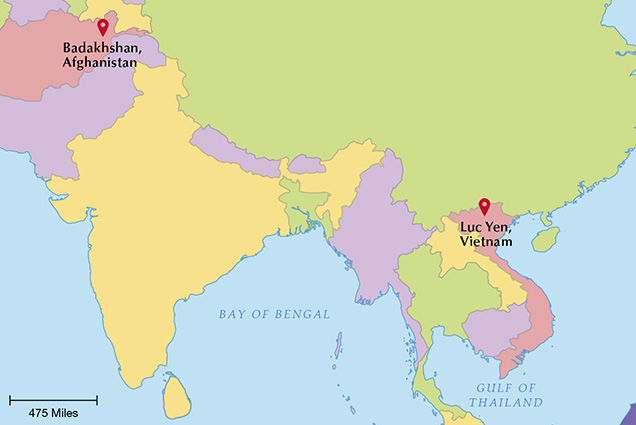
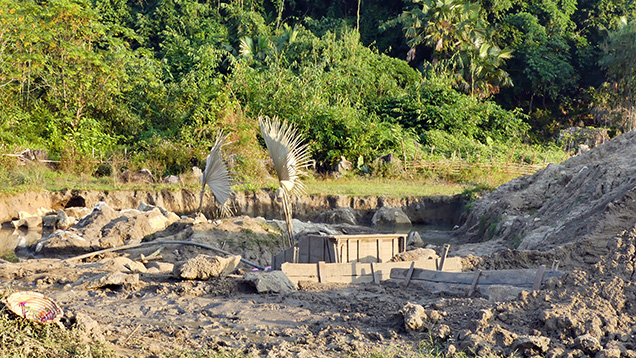
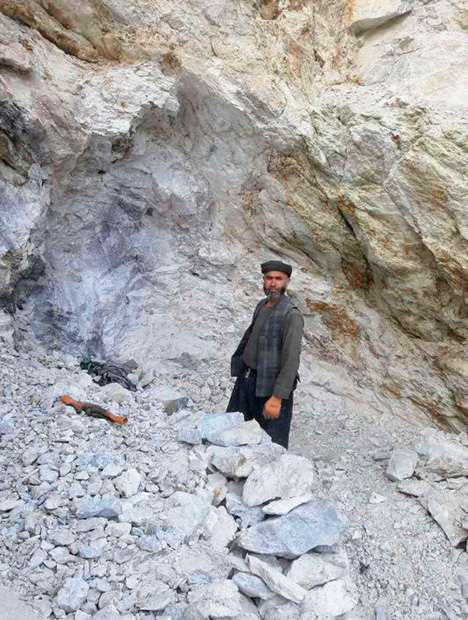
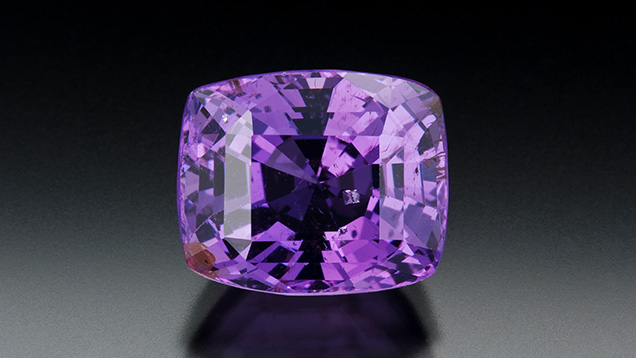
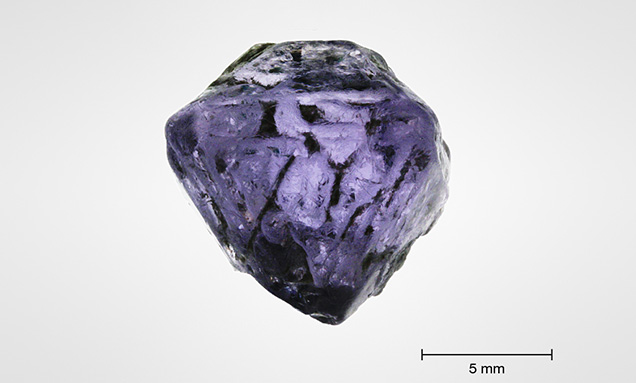
Gem-quality spinel occurs in a variety of colors as a result of a diverse array of possible chromophores and chromophore combinations (Schmetzer et al., 1989; Andreozzi et al., 2019): combinations of Fe2+ and Fe3+ (light blue/violet to green to black with increasing Fe concentration; Hålenius et al., 2002); Co2+ (blue; Shigley and Stockton, 1984; D’Ippolito et al., 2015); Cr3+ (red); and V3+ (orange; Andreozzi et al., 2019). Vivid spinels colored by cobalt (blue) and chromium (red) are particularly sought after in the gem trade. Purple spinel (figure 1) is generally colored by Fe or by a combination of Cr, V, and subordinate Fe (Andreozzi et al., 2019). The current study compares the chemical composition and color of two purple spinel samples, from Vietnam and Afghanistan (figure 2), to each other and in the broader context of all gem spinel. One is a saturated purple sample from a placer deposit near Khao Ka in the Luc Yen district of Vietnam (figure 3). The second sample is a purple spinel with light to medium saturation, mined from a marble-hosted deposit in Badakhshan, Afghanistan (figure 4).

MATERIALS AND METHODS
Materials. The Vietnamese spinel (sample VN, figure 5) was acquired from Geir Atle Gussiås and Mai Tran of Balder Gems. They purchased it from miners on-site at the Khao Ka alluvial deposit, northeast of Nà Hà, An Phú, in the Luc Yen district (approx. 21°58′54.37″ N, 104°50′44.77″ E; see also Chauviré et al., 2015). Mr. Gussiås suspected that the spinel sample was enriched in both cobalt and chromium due to its unusual color; he has reported a similarly saturated purple stone, faceted and just under 2 ct from the same placer locality. The Luc Yen region is underlain by supracrustal metamorphic rocks including significant quantities of marble, the typical source rock for gem spinel (Chauviré et al., 2015 and references therein). The purple spinel (sample AF, figure 6) from a metacarbonate outcrop in the Badakhshan Province of Afghanistan (the “Parawara mine” in Boehm, 2017) was mined in 2017 and donated by gem and mineral dealer Ikram Muhammad. Samples VN and AF were flat-polished for UV-Vis spectrometry at GIA’s Carlsbad laboratory, with thicknesses of 2.155 mm and 4.486 mm, respectively.
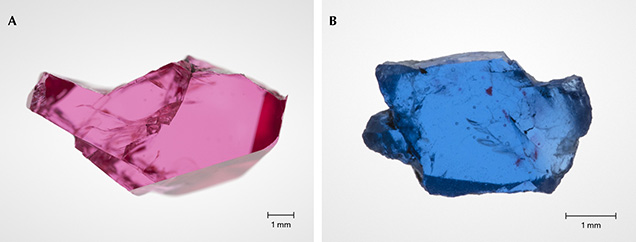
Two spinel samples from the GIA collection provided reference UV-Vis spectra of Co2+-dominant, and Cr3+-dominant spinel color end members for use in assessing the color contribution of these chromophores in sample VN. The spinel dominantly colored by Cr3+ is vivid pink (GIA sample 100305165116, 2.641 mm thick, named “GIA-Cr”; figure 7A) and the spinel dominantly colored by Co2+ is vivid blue (GIA sample 100305162587, 1.053 mm thick, named “GIA-Co”; figure 7B).
Methods. Electron Probe Microanalysis (EPMA). For EPMA analysis, the samples were mounted in epoxy pucks and polished. Chemical compositions were obtained with a JEOL JXA-8230 electron microprobe (University of Ottawa) in wavelength-dispersion (WD) mode. The operating voltage was 20 kV, with 20 nA beam current and 5 μm beam diameter. Counts were collected for 20 seconds for each element. The following standards were used (all Kα): hematite (Fe), chromite (Cr, Co, Al, Mg), rutile (Ti), tephroite (Mn), pentlandite (Ni), vanadinite (V), and gahnite (Zn). Matrix correction calculations were performed using the Armstrong/Love-Scott φ(ρZ) method (Armstrong, 1988). Limits of detection were 0.01 wt.% (MgO, Al2O3), 0.02 wt.% (V2O3), and 0.03 wt.% (Cr2O3, FeO, CoO, NiO, MnO).

Trace Element Analysis. Laser ablation–inductively coupled plasma–mass spectrometry (LA-ICP-MS) analyses of samples VN and AF were performed using a 193 nm ArF excimer laser ablation system (ASI Australia RESOlution M-50-LR) connected to an Agilent 7700x quadrupole ICP-MS at the Pacific Centre for Isotopic and Geochemical Research at the University of British Columbia in Vancouver, Canada. Measurements were performed for 40 s at a laser repetition rate of 5 Hz, 20 ns pulse width, using a spot size of 89 μm. On-sample fluence was 3 J/cm2. Ablation was carried out under a helium atmosphere. A mixture of He (from the sample cell) and Ar served as carrier gas and was admixed with N2 for signal enhancement. The mass spectrometer was tuned for sensitivity, ThO/Th <0.2% and a mass bias with 238/232≈101%. Spots were pre-ablated to remove surface contamination, followed by 40 s of ablation and a 30 s washout time. The following masses were collected: 7Li, 9Be, 11B, 49Ti, 51V, 53Cr, 55Mn, 56Fe, 59Co, 60Ni, 67Zn, and 69Ga. Measurements on the following elements were collected but not detected in the spinel samples: Sc, Cu, Sr, Y, Zr, Hf, Ta, and rare earth elements. Calibration was carried out by standard-sample bracketing using the silicate glass SRM NIST 610 as the external standard and 25Mg as the internal standard using values from EPMA (table 1). USGS basalt glass reference material BCR-2G (Rocholl, 2007) was cross-checked for quality control and was within the range consistent with values in the GeoReM database (Jochum et al., 2005). The coefficient of variation for individual trace element measurements in BCR-2G is ≤6%, with the exception of Be (~11%) and B (~38%). Measured B concentrations varied unpredictably despite drift correction, and thus the data was rejected. Data reduction was performed using the Iolite v.3.0 software (Paton et al., 2011).

LA-ICP-MS trace element data was collected for samples GIA-Cr and GIA-Co at GIA using a Thermo iCap-Q ICP-MS coupled to an Elemental Scientific Lasers NWR213 nm laser ablation system with a frequency-quintupled Nd:YAG laser (213 nm wavelength with 4 ns pulse width). Ablation was carried out with 55 µm spot sizes with fluence around 8±1 J/cm2 and a 15 Hz repetition rate. NIST 610 and 612 glasses were used as external standards with 24Mg set as the internal standard with a value assigned at 17.08 wt.%. Masses analyzed include 7Li, 9Be, 47Ti, 51V, 52Cr, 55Mn, 56Fe, 59Co, 60Ni, 66Zn, and 69Ga. The trace element compositions of GIA reference samples are reported in table 2.
Parts per million by weight (ppmw) values were converted to parts per million atoms (ppma) using the following formula:
[ppma] = [ppmw] × (mol. wt. of spinel)/(7 × atomic wt. of element)
where 7 is the total number of atoms in one formula unit of spinel.
Spectrophotometry. Ultraviolet/visible/near-infrared (UV-Vis-NIR) absorption spectra were measured using a custom-built setup equipped with an Ocean Optics HR4000 CCD spectrometer and an Avantes light source incorporating both halogen and deuterium light sources. Light was transmitted to the sample placed at the entrance to an integrating sphere and then to the detector using fiber-optic cables. Data was collected with one accumulation using an integration time of 10 s at wavelength interval of 0.76 nm and spectral resolution of 0.90 nm from 300 to 800 nm.
Reference Spectra and Absorption Peak Assignment. The UV-Vis spectrum for purple spinel sample VN was compared to two reference spectra: a Cr-dominant spinel spectrum (vivid pink, GIA-Cr) and a Co-dominant spinel spectrum (vivid blue, GIA-Co). The spectra were selected for their highly dominant absorption signature by the chromophore of interest with negligible absorption by other chromophores. The spectra contain very small Fe2+ absorption peaks that were imperceptible when the spectra were scaled down for data processing.
The reference chromophore absorption peaks (wavelength in nm) are averages for Mg-Al spinel samples reported by Andreozzi et al. (2019) and D’Ippolito et al. (2015; cobalt only): (MCr3+) 349.4365, 387.3352, 420.9564, 531.5635, 570.5204; (MV3+) 394.2329, 541.0837; (MFe3+) 458.5660, 476.2484; (TFe2+) 374.2733, 386.7225, 406.9652, 554.5731, 587.8204, 798.6127; (TMn2+) 428.2166; (TCo2+) 552.6287, 588.0105, 630.7159.
Raman Spectroscopy Analysis. Raman spectra of inclusions in the spinels were collected with a Renishaw inVia Raman microscope system. The Raman spectra of the inclusions were excited by a Stellar-REN Modu Ar-ion laser producing highly polarized light at 514 nm and collected at a nominal resolution of 3 cm–1 in the 2000–200 cm–1 range. Each spectrum was accumulated three times with a collection time of 10 s at 20× or 50× magnification. In many cases the confocal capabilities of the Raman system allowed inclusions beneath the surface to be analyzed.

RESULTS
Sample Descriptions. Samples VN and AF are transparent with few inclusions. Sample VN, 3 mm in thickness (later polished to 2.155 mm), had a medium tone, strong saturation, purple hue, weak to moderate orange-red fluorescence under long-wave (365 nm) ultraviolet radiation, and a very slight color change between daylight (standard 6500 K fluorescent bulb) and incandescent illumination (standard halogen incandescent bulb at ~2700 K); see figure 5, A and B. Sample AF, 5 mm in thickness (later polished to 4.486 mm), had a medium tone, moderate saturation, and purple hue (figure 6) and was nonfluorescent when exposed to long- and short-wave UV.
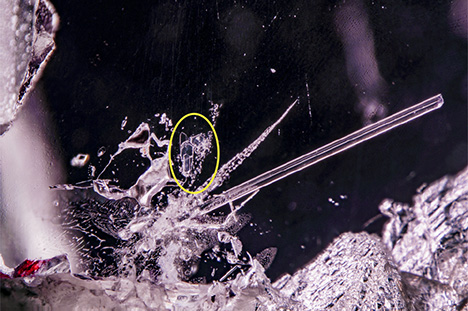
Inclusions. The purple spinel from Vietnam contained several distinct mineral inclusions. Raman spectroscopy allowed the identification of several black platelets as graphite and several colorless minerals as magnesite, which are also known to occur in red gem spinel from Vietnam (Malsy et al., 2012). Occasionally, composite inclusions of graphite and magnesite were seen (figure 8A). Additional inclusions in sample VN were observed but could not be positively identified with Raman, such as platelet-like colorless crystals (potentially phlogopite crystals) and needle-like inclusions that resembled rutile inclusions (figure 8B) seen in other gem minerals. Among the inclusions seen in the Afghan spinel were fields of negative crystals (presumably hosting fluid inclusions), tiny black dust-like particles, and colorless mineral inclusions. Some of these inclusions were identified by Raman spectroscopy as phlogopite. The elongate inclusion in figure 9 was identified by Raman spectroscopy as an amphibole-group mineral, but the peaks overlapped with the background spinel signal, precluding conclusive amphibole species identification.
Chemical Composition. Spinel compositions were measured using EPMA and LA-ICP-MS, where the EPMA data (table 1) is used to provide major and minor element composition, including Mg for use as an internal standard for LA-ICP-MS.

The purple spinel from Vietnam (sample VN) contained significant concentrations of multiple chromophores (table 3): 593 ppma Cr, 17.9 ppma Co, 84.8 ppma V, and 2437 ppma Fe. The purple spinel from Afghanistan (sample AF) was very poor by comparison in most chromophore elements—namely Ni, Zn, and Ga—but contained more Fe (3089 ppma) and Mn (56.8 ppma).

Absorption Spectra. In the absorption spectrum of sample VN, two transmission windows occurred between ~430 and 510 nm (blue-green range of visible spectrum), and above 650 nm (red range of the visible spectrum). The absorption was characterized by two broad peaks centered at approximately 390 and 545 nm, in addition to a characteristic cobalt peak at ~630 nm (figure 10). The absorption spectrum profile for the purple spinel from Afghanistan was flatter than for the Vietnamese sample, with peaks at 558 nm (broad), 383 nm, 370 nm, two small peaks at 455 and 475 nm in the trough between the former, and a significant and rapid increase in absorption at wavelengths below 360 nm (figure 10). The absorption bands are consistent with those of iron (D’Ippolito et al., 2015).

DISCUSSION
Color. Sample VN had characteristic absorption maxima attributed to Cr3+ at ~530 and ~390 nm; Co2+ at ~620 nm (the reference absorption is 630 nm, from D’Ippolito et al., 2015); and TFe2+ (shoulder at ~370 nm; figure 10; Andreozzi et al., 2019). To better illustrate the color contribution of cobalt and other chromophores in this Vietnamese purple spinel, reference spectra of spinels colored by Co2+ and Cr3+ were used to perform scaled subtractions from the VN spectrum (reference peaks for Co2+ at ~620 nm and Cr3+ at ~389 nm; similar to the method of Palke and Sun, 2018). The reference spectra (GIA-Co and GIA-Cr) showed imperceptible color contributions by other chromophores when scaled down for the subtraction, and therefore they did not noticeably reduce peaks from other chromophores in the resulting difference. The resulting subtracted spectra (figure 11) clearly demonstrated that sample VN was dominantly colored by both Co2+ and Cr3+, while the color contribution by TFe2+ (e.g., the peak at 374 nm) was present but negligible. Color contribution by V3+ is possible and difficult to quantify due to peak overlaps with Cr3+, but when present it is relatively minor (see for example, absorption spectra of Cr-V-bearing spinels in Malsy and Klemm, 2010). A notable feature of the VN absorption spectrum is a relatively prominent “shoulder” at ~620 nm, which demonstrates a noteworthy effect of Co2+ on the color of this purple spinel even without data processing. Sample VN is the first described example of natural purple spinel in which both Cr3+ and Co2+ are the prominent contributors to the coloration and are roughly equally weighted (e.g., similar absorption peak heights above background for each chromophore, resulting in a distinctly purple hue), as opposed to Cr3+-(Fe2+,Fe3+)-dominant or Fe (Fe2+,Fe3+) alone (e.g., Schmetzer et al., 1989; Malsy and Klemm, 2010). Kuksa et al. (2019) presented compositional data and a photograph of a Vietnamese spinel described as “bluish” (within the reference sample known as sample 5), which appeared vivid blue with a slight purplish hue in the figure. This sample appeared dominantly colored by cobalt with subordinate chromium, and its chemical composition is discussed further below.
Purple spinel sample VN has a higher color saturation than purple sample AF (colored by TFe2+ with minor MFe3+), which is shown by the greater peak-trough difference in absorption spectrum (figure 10). This is evidently due to the greater visible light absorption by Cr3+ and particularly Co2+ per unit of concentration compared to the predominant iron chromophore, Fe2+ (e.g., ~20× molar absorptivity of Co2+ relative to Fe2+, Chauviré et al., 2015), but could also be accentuated by VN’s red fluorescence. Therefore, the combination of elevated cobalt (17.9 ppma) and chromium (593 ppma) concentrations as the dominant chromophores result in an attractive purple color that is more saturated, with stronger red and blue hues, than spinel colored primarily by TFe2+. Sample 3 from Kuksa et al. (2019), a brownish purplish red spinel from Vietnam, also serves as an interesting comparison to purple sample VN. Sample 3 contained a similar concentration of Cr, slightly over half the Co concentration, and four times the Fe concentration. Unlike sample VN, which is purple primarily due to Cr and Co, Kuksa et al.’s sample 3 was brownish purplish red, likely representative of a color defined primarily by Cr and Fe. Kuksa et al. (2019), did not measure light absorption, so the causes of color have not been quantified.
Spinel sample VN represents the “missing link” in Schmetzer et al.’s (1989) spinel color/chromophore diagram, being roughly intermediate between the red (Cr3+) and blue (Co2+) end members.
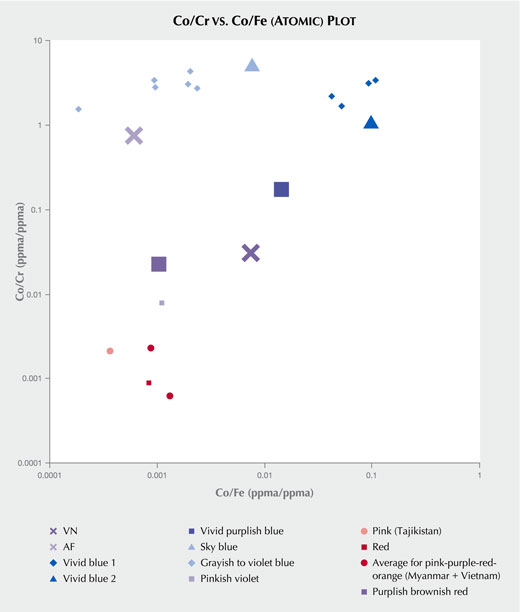
Chromophore Trace Elements in Gem Spinels. Cobalt-enriched spinel, generally vivid blue in color, typically contains low Cr concentrations (<60 ppma; Hanser, 2013; Chauviré et al., 2015; Kuksa et al., 2019), with two outliers known from Vietnam. One Cr-rich outlier (1111 ppma Cr and 1236 ppma Co; Chauviré et al., 2015) reported from Vietnam is vivid blue in color with no visible reddish or purplish hues, indicating that cobalt has a much higher molar absorptivity than chromium, similar to cobalt’s higher molar absorptivity relative to iron (Chauviré et al., 2015). The other outlier, sample 5 of Kuksa et al. (2019), has a vivid slightly purplish blue color. Purple spinel sample VN appears to be approximately compositionally intermediate between Cr-dominant pink/red spinels and Co-dominant blue spinels, whereas sample 5 is intermediate between sample VN and Co-dominant blue spinels, as shown in a plot comparing the relative concentrations of Co to Cr, and Co to Fe (figure 12).
Most Cr-enriched spinels (red, pink, magenta, and orange gem spinels) are very poor in cobalt (Co <6 ppma; Malsy and Klemm, 2010), and thus their color is largely determined by Cr3+, V3+, and Fe (Fe2+,Fe3+) concentrations (Schmetzer et al., 1989; Andreozzi et al., 2019). Among spinel trace element compositions recorded in the scientific literature, only Kuksa et al.’s (2019) sample 3 has a cobalt-to-chromium ratio similar to that of sample VN. However, their sample 3 is poorer in cobalt overall (10.6 ppma) and four times richer in iron than VN. Thus, sample VN is primarily an intermediate between a Cr-dominant red spinel and a Co-dominant blue spinel, while sample 3 is intermediate between spinels having Cr3+ and Fe (Fe2+,Fe3+) as the dominant chromophores, respectively. This also correlates with their relative positions in a chemistry-based discrimination plot (figure 12). Unlike Kuksa et al.’s sample 3, VN has a sufficiently high Co2+ concentration and low Fe (Fe2+,Fe3+) concentration so as to be colored strongly saturated purple with an absorption spectrum showing clear characteristic absorption maxima from both Cr3+ and Co2+.
While sample VN plots intermediate to Cr-dominant and Co-dominant spinels in a plot of Co/Cr vs. Co/Fe (figure 12), sample AF plots in the iron-dominant portion (Cr-poor, high Co/Cr, low Co/Fe). Overall, gem spinels appear to be easily differentiated according to dominant chromophores using a chemical discrimination plot of Co/Cr vs. Co/Fe, although this plot will not work well for spinel in which V3+ is the dominant chromophore, or for spinel based on Fe2+/Fe3+ relative abundance or with elevated Fe concentrations (e.g., green and black Fe-rich spinels; Hålenius et al., 2002).
CONCLUSIONS
The purple spinel sample from the Khao Ka placer deposit in the Luc Yen district of Vietnam (sample VN) was colored primarily by cobalt (17.9 ppma) and chromium (593 ppma), with minor iron (2437 ppma) and possibly vanadium (84.8 ppma). It contained significantly more cobalt than typical chromium-enriched gem spinels (<6 ppma Co). The similarly important contributions of cobalt and chromium to visible light absorption, the first such natural example to be reported, resulted in a purple of higher saturation than in the purple spinel sample from Afghanistan, which only had an iron chromophore (3089 ppma Fe; <10 ppma V, Cr, and Co). In the Vietnamese purple spinel, a relatively low iron concentration was also essential in creating an attractive saturated color, as shown by a comparison with a similar but more iron-rich spinel from the same region.
The purple spinel from Vietnam was enriched in chromium, cobalt, vanadium, gallium, and zinc relative to the sample from Afghanistan, which was poor in all chromophore elements with the exception of being slightly richer in iron and manganese.
The Vietnamese purple spinel represents an approximate intermediate between natural spinel populations colored dominantly by chromium and those colored dominantly by cobalt. A vivid purplish blue spinel from Vietnam reported by previous authors represents an intermediate more strongly weighted toward cobalt. Gem spinels of different colors are easily differentiated by chemical composition using a discrimination plot of Co/Cr vs. Co/Fe, but this is valid for spinel not dominantly colored by V3+ or containing elevated concentrations of Fe (e.g., green and black Fe-rich spinel).
.jpg)


