Optimizing Face-Up Appearance in Colored Gemstone Faceting
ABSTRACT
The human visual system interprets visual cues to perceive different intensities of brightness. Patterns of light and dark contrast create impressions of brightness in faceted gemstones. These patterns generally remain coherent in the viewer’s eye when the gemstone is tilted or rotated. Using computer-generated color-coded contrast maps in facet planning can improve apparent brightness, optimizing a gemstone’s appearance.
UNDERSTANDING BRIGHTNESS AND CONTRAST
Understanding what creates the impression of brightness can help us map and plan areas in a gemstone to enhance observed brightness.Cognitive scientists understand much of the complexity of the stimuli processed by our visual system. For example, even though variations in lighting result in varying wavelengths of light reflected from a colored surface, our visual intelligence system actually works as a subconscious processor, assigning a constant hue, saturation, and tone (which scientists refer to as “lightness”). This collaboration between the visual system and the brain is constantly extracting information from a flood of sensations to construct a visual world. In the words of leading cognitive scientist Donald Hoffman (1998), “You are a creative genius. Your creative genius is so accomplished that it appears, to you and others, as effortless. Yet, it far outstrips the most valiant efforts of today’s fastest supercomputers. To invoke it, you need only open your eyes.”
These scientists work primarily with two-dimensional printed (opaque) images or flat images on a computer monitor, and they consider brightness a subjective attribute or property of an object being observed. Gemstones are three-dimensional and transparent, and the light reflected from within them has a greater impact on their face-up appearance than the light reflected from the surface. Our visual intelligence processes visual cues so we see a gem that seems to generate light from within itself, in a pattern that changes as the gem moves. This pattern is generated by the interaction of light with the faceting design.
Jose Sasián, a professor of optical sciences at the University of Arizona, explains that while looking at a gem, the observer appears to see more facets than actually exist. Sasián (2007) calls these “virtual” facets. These perceived facets are a result of different levels of contrast, caused by light striking all the facets and then splitting, creating the appearance of many more facets.
How we interpret visual cues is critical to understanding what creates a gemstone’s beauty, and by studying these cues we can identify the elements to include in gem design.
The following is a general overview of the visual cues relevant to faceted, transparent gems.
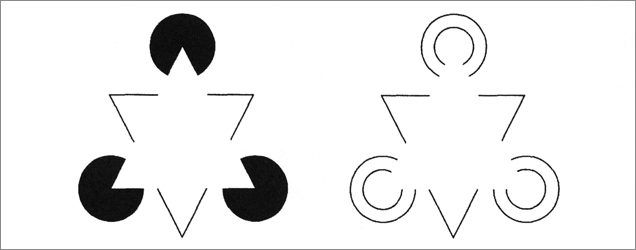
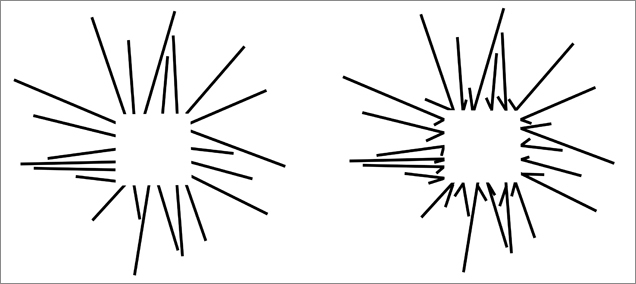
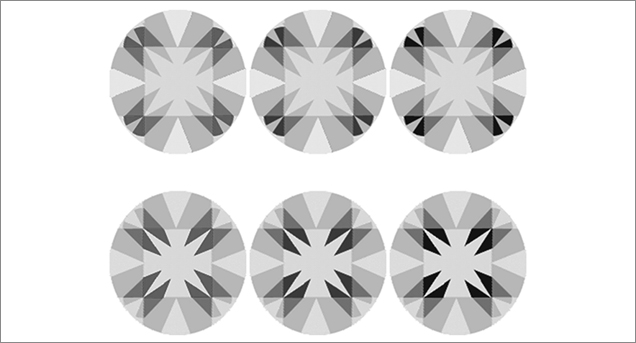
Invisible Surfaces. Termed by some vision scientists as “the invisible surface that glows,” the illustration created by G. Kanizsa (1955) shows two different triangles that are more luminous (i.e., brighter) than the background, and whose borders are easily observed even though there are no lines defining them (figure 2). Using a photometer, one cannot detect any edges of the triangle. The borders and luminosity are purely the construction of the observer’s visual intelligence system. The brain uses a variety of cues to construct these images, which we will refer to as “invisible surface maps.” In figure 3, the invisible surface map on the left has a more luminous square area than the map on the right. How the brain perceives the lines that resemble small “check marks” causes this duller effect.



Yet the circles on the right are dull due to weak contrast. A gemstone’s
visual interest depends on good contrast. If it returned all light and had
no contrast, the gemstone would be uninteresting.
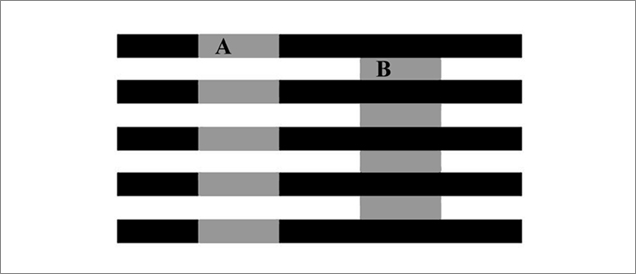
In figure 9, the horizontal stripe and all six boxes have the same brightness and color, but the squares’ apparent brightness depends on the contrast of the surrounding area. In this illusion demonstrating “simultaneous lightness contrast” (an example of lateral inhibition), apparent lightness is different from quantitative lightness, the real measurement of the total lightness reflected from an object. The phenomenon also occurs when a colored area is placed on a dark background, making it appear clearer, brighter, or more luminous. In figure 10, for example, the navette shapes at the bottom are identical, but they appear to be different colors when placed on alternating light and dark backgrounds (C). The difference is accentuated with the addition of an interwoven background (A and B).


darker or lighter depending on the adjacent areas. From Sarcone and Waeber (undated).
If we understand what causes the cues for brightness in any shape, we can use this information to design effective facet patterns by using strong contrast and ending the lines of contrast to produce a bright center. A gem’s brightness and attractiveness depends not only on how much light is returned—angles are still important—but also on the contrast pattern created by virtual facets. Once an effective pattern is established, the major elements of that pattern must remain in effect when the gem is tilted to maintain the appearance of brightness. This means that the pavilion angles cannot be cut near an angle that allows the gem to “window,” letting light leak through. If the slightest tilt interrupts the pattern due to a window, the pattern is not effective because the contrast pattern has been eliminated. The impact of these effects may vary according to the level of brightness, as dictated by refractive index and color saturation.
TOOLS FOR ASSESSING CONTRAST
If contrast is an important part of faceting various gem materials, there needs to be a reliable method to determine elements of contrast. Most critical is the contrast caused by the reflection of the observer’s head and torso. Harding (1975) first identified this critical element: the effect of an observer’s head blocking rays of overhead illumination. He calculated the rays returned from the gem to the viewer’s eyes, as well as the illumination blocked by the viewer’s head.Regarding head obstruction, Harding writes, “For ultimate liveliness it should be possible to see reflections in the table from both sides of the pavilion with both eyes at once. At a viewing distance of one foot, as shown in [figure 12], the angle between reflections to both eyes (two different rays) is about 12°. To see reflections from both sides with both eyes, therefore, the minimum external table reflection angle must be at least 6°.” While not directly discussing the need for contrast, Harding alluded to its importance. Of course, liveliness stems from scintillation, the result of strong contrast between neighboring facets when the gem, the light source, or the observer moves.

between neighboring facets when the gem, the light source, or the observer moves.
An observer’s head (shown from above) obstructs overhead light, causing a sharp
change in the light streaming into the gem. Note that at a viewing distance of one foot
(approximately 30 cm), the angle between the two reflected rays that return to both
eyes is about 12°. From Harding (1975, figure 8).

contrast against a red reflecting field. Studying the patterns of different diamonds, JDM
concluded that the most attractive diamonds have a certain contrast pattern. From an
undated FireScope brochure, circa 1987.
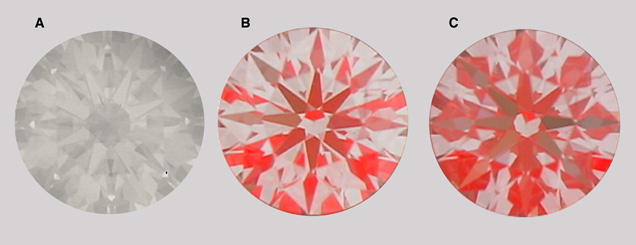
To better understand this, consider what a faceted gem might look like in a totally diffuse white-lit environment (figure 14). If the gem reflected nothing but white light, it would have no contrast (A). If you were to cover your face and shoulders with a fluorescent red mask and view the gem in the same environment, you would see red contrast (B). If you moved closer to the gem, there would be even more red reflected throughout it (C).

Comparison of Two Important Models. While DiamCalc supports a variety of lighting environments, this paper deals with two of particular value in design optimization: AG and ASET (figure 16). These are variations of the color coding of light entering a diamond from specific surrounding arcs, patented in 2000 (Gilbertson, 2003) and 2004 (Caudill et al. 2008), respectively. While either can be used as a primary environment for planning or as a secondary double check, the AG environment offers certain advantages as the primary. Comparing the three-color ASET and the five-color AG patterns for the same stone, observe how their angles of light orientation differ. Key information about both the observer (black, 83°–90°) and the lower angles of light entry likely producing a strong contrast (dark violet, 40°–55°) are not represented well in the ASET image. Three color-coded zones do not provide enough information, as certain patterns with strong contrast (black) can produce some of the visual cues leading to different preferences.
If a design is planned with AG and then checked with ASET, however, nuances and slight weaknesses in design can be captured and modified later. These examples represent diamond’s RI and the sets of angles considered optimum for diamond appearance. Since individuals may prefer different patterns, which can vary depending on RI, it is advisable to determine personal preference before analyzing patterns with AG and ASET lighting.
DiamCalc also allows the background to be color-coded. A black background is the default setting for both the AG and ASET environments, but white is also available. Areas where light passes through the gem from the background (“windows”), are indicated as white in the contrast plot when using the white background.
PRACTICAL APPLICATION
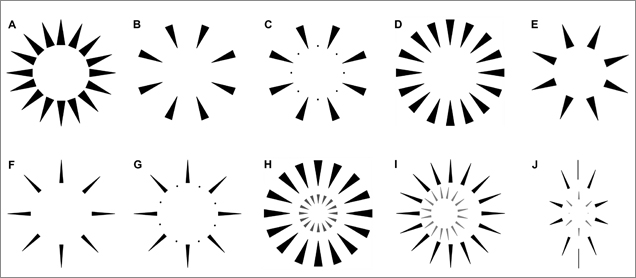
Past work can be useful for further understanding the AG lighting environment. For example, both GIA and the American Gem Society have determined that the most appealing round brilliant-cut diamonds have a balance of contrast and brightness (GIA, 2006; Sasián, 2007). The contrast maps of a typical well-cut diamond are shown in figures 16 and 17 to illustrate the relative balance of the various color-coded light entry angle ranges. Much like the invisible surface map examples in figure 5, these color-coded contrast maps can explain the pattern seen in the cut gem with AG lighting (figure 17).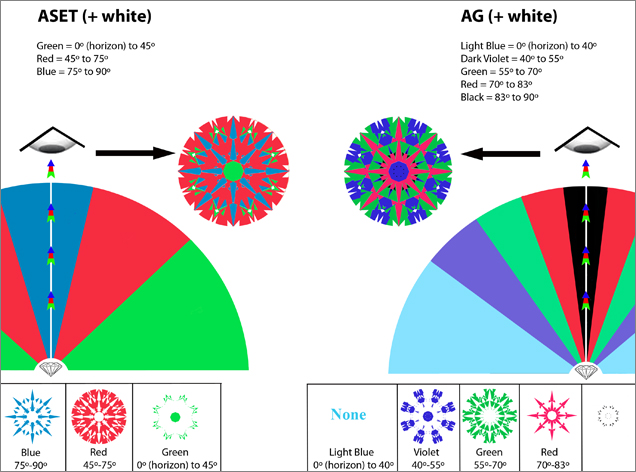

The contrast maps display a substantial amount of green, which is represented by light coming from around the observer’s head (55º–70º). The red (70º–83º) is arranged in a narrow, wagon-wheel pattern from the girdle edge to the near-center. Red areas can appear dark or bright, depending on the observer’s proximity to the gem or how much it is tilted. Both of these colors indicate the primary areas of brightness in a gem, comparable to the white area in the invisible surface maps. An effective design requires these areas of brightness to be prominent and well distributed, with the dark areas creating a balanced, contrasting pattern in the gem.
Contrast maps are similar to a much more complex stacked invisible surface set (such as figure 5H–J). As the invisible surface maps are moved and rotated, the apparent brightness increases dramatically and remains organized in a viewer’s mind even when the direction of observation is changed. This means that movement (rotating and flickering) of the invisible surface maps is comparable to the scintillation seen when a gemstone moves back and forth. With the proper types of contrast in adjacent virtual facets of the red areas, the gem will be more interesting and attractive, and in many cases appear brighter. Note that while brightness may be the goal, too many areas of brightness can lighten the saturation of the color in large portions of the gem, lowering its market value.
EXAMPLES
Figure 18 shows examples of various gems purchased from the trade for GIA’s Dr. Eduard J. Gübelin Collection. The individual gems were scanned using a non-contact measuring device to derive the facet angles and arrangement. A photo of each gem, showing the representative pattern viewed face-up, is accompanied by an AG contrast map derived from DiamCalc. The observer’s face and torso are about 18–20 inches from the stone, and the photo captures a good representation of what the observer would typically see in the gem. The following is a brief discussion on the appearance of each gem.
Figure 18B: When gently rocking this apatite (RI near 1.64), the observer sees much of their own dark reflection in the middle. The apparently bright outer edges in the photograph of the stone are actually dull; the observer sees through the gem. This produces a stone that is not very attractive or visually dynamic. The black area of the color-coded contrast map (AG with white contrast map) is a reflection of the observer. Red and green indicate higher contrast areas of brightness, and some of the outer areas contain dull blue-green, resulting from lower-angle lighting. Again, the outer white areas are windows.
The next two examples show better cut optimization:
Figure 18C: Despite this amber’s soft appearance (RI near 1.54) caused by facets that are slightly rounded and less crisp, its brightness—even when rocked—comes from effective use of high-angle entry light to provide dynamic contrast and minimal observer reflection (black). In the red areas of the map, the observer’s reflection may come into view when the gem is slightly tilted. The prominent green areas represent a large amount of bright light entering the gem. The even distribution of red and green from culet to girdle adds to the attractiveness. Minimal areas of blue (lower-angle lighting) and white (windowing) keep this gem bright.
Figure 18D: This grossular garnet (RI near 1.74) is bright and does not window easily, even when rocked. Its brightness comes from the effective use of high-angle light entry to create a good mix of dynamic contrast, with little reflection of the observer. Red areas indicate that when the gem is slightly tilted, the observer’s reflection may come into view. The abundance of green areas helps by directing bright light into the gem. For maximum visual appeal, the red and green areas should be evenly distributed and extend from culet to girdle. In this map, there is little blue (lower-angle lighting) or white (windowing).
APPLICATION TO GEMCAD-BASED OR 3-D WIREFRAME DESIGNS
The following discussion provides examples of how to read and interpret the AG contrast maps to optimize cutting schemes. Six different GemCad designs specifically for quartz (or other gems with an RI near 1.55) were chosen from the DataVue file of GemCad designs. The name of the design, the creator, and the publication where it first appeared are listed. Each shows a table where the pavilion depth and crown height change by 1% of girdle width (and all pavilion and crown angles change accordingly). The resulting angles can be obtained from the GemCad file, but for simplicity this article uses crown and pavilion percentage differences. The table size is constant, as altering it would result in many more combinations. The original design’s proportions are outlined and marked “original.” For reference, the graphic design is also shown, accompanied by a contrast plot for an idealized round brilliant. The idealized contrast plot demonstrates the types of color distribution that contribute to effective designs. It serves as a visual reference for the types of dominant colors and balance that might be desired. Download Full-Size AG Contrast Maps (Figures 19–24)
 Design 13022 (figure 19): This design performs well with a variety of angle differences. It is a very forgiving design that can be used with a variety of crown heights to better utilize the rough. But note that all of these contrast plots have a predominance of green in the middle. Where does the contrast belong? Green represents brightness, but brightness alone is not terribly interesting. For more visual interest, a cutter could try a 46% pavilion/21% crown or a 47% pavilion/12% crown modification to add contrast. As mentioned before, trying several patterns will help identify which specific elements are the brightest and most attractive.
Design 13061 (figure 20): This example demonstrates the need for caution in trusting a cutting plan, regardless of the source. The original gem is fairly dull, perhaps due to a typographical error in the plan, a design not meant for quartz, or incorrect entering of the angles. While a large amount of red around the girdle edge does not always produce the best design, the 41% pavilion/11% crown combination may provide the most contrast, with some blue at the girdle edge to break up the red.
Design 13096 (figure 21): This design offers abundant contrast, and the resulting gemstone would be quite dynamic. Whereas the contrast areas with combinations of red and red/black can slightly darken the stone, green/red is generally a better combination. Designs should minimize blue points in the center. For this design, a 45% pavilion/11% crown or 41% pavilion/17% crown would be more effective.
Design 13138 (figure 22): Of the triangular designs chosen for these illustrations, this is probably the most dynamic example. It is another forgiving design and also has high contrast all the way into the middle of the stone, with greens and reds throughout. While the original proportion set has a little too much blue in that quadrant of the plots, it would still produce a very good appearance. Slightly increasing the pavilion depth—for instance, 47% pavilion/14% crown—would improve the design.
Design 13141 (figure 23): Note the prominence of red among these choices. The red areas start to pick up reflections of the observer (black areas) when slightly tilted, sometimes darkening the stone slightly. Therefore, this design should not be used with dark material, and only with slightly light or medium colors. The original angle combinations offer a good balance between contrasts of different light-entry angles. If the material is slightly dark, a 44% pavilion/12% crown will produce a little less darkness in the stone.
Design 13146 (figure 24): Note that this gem has a narrow range of feasible pavilion depth. At 45%, there is strong windowing, which also occurs in the white area in the 46% column. While not shown here, tilting the example in the 46% column will also produce windowing. At 50%, the substantial amount of blue (low-angle light entry) does not allow much brightness. The original proportions will work very well, but higher proportions of green in a contrast map—for instance, 48% pavilion/17% crown—are generally preferable. To achieve good contrast, the adjoining facets need to have offset angles. This design only does so in a very narrow range of proportions.
Computer modeling can assist in effective design by simulating the best angle combinations and/or modifying the design (adding or removing facets, or changing their placement). By using lighting schemes such as AG and ASET in design planning, facet arrangement can be optimized to produce the most visually interesting results.
GENERAL CUTTING CONSIDERATIONS
2. Step cuts are more difficult to optimize. With the addition of four or more rows on the pavilion, the difficulty increases. In optimizing step cuts, very careful attention must be paid to step width, as well as the design execution.
3. Some designs are more effective for certain RI ranges than others. For example, the standard round brilliant is far more effective for gems with a high RI (diamond, zircon, etc.) than for lower-RI materials.
4. The gem’s physical size also dictates design considerations. For example, when cutting a 10 mm gem, a simple single-cut design with eight pavilion and eight crown facets (plus the table facet) is not as effective as a 57-facet round brilliant design. A 181-facet design, for instance, does not succeed unless the gem is of substantial size, because tiny facets are less distinct and look “fuzzy.”
5. Adding small facets to designs that contain large facets is rarely practical. For example, splitting stars into three small facets while leaving the others at a normal size will have little effect and may actually diminish the design. Often that center facet provides less contrast than if there were only two facets.
6. Every now and then, faceters concern themselves with dispersion, which jewelers refer to as “fire.” It is a measurement that indicates how much light is spread by different materials. Generally, lower-RI gems do not contain much visible fire. Adding color saturation to the material hides what little fire might be there. On the other hand, highly dispersive gem materials (with dispersion values above 0.039) provide some unique opportunities to display fire. This effect depends on two considerations:
a. Lighting environment: Where the lighting is primarily diffused (e.g., reflected from a white ceiling with no direct spot-type source directed at the gem), the observer will see little fire. If the lighting environment provides strong contrast, using bright spot-lighting against a dark background, fire is strongly enhanced.
b. Strong contrast: Areas of strong contrast in the gem will create fire as those areas alternate between dark and bright when the gem is rotated. Figure 25 shows a gem being rotated in 2º increments with the light source in a fixed position. As the gem is rotated, the movement of facets causes them to fluctuate between dark and light. At the threshold between light and dark, the observer will see fire. If the gem is moved slowly, with facets only slightly changing in relation to the light source and the reflection to the eye, the change in color of the facet will be gradual. If movement is sudden, the observer may only see where the facet is dark and then light, without seeing the fire. When a facet only slightly darkens or lightens, fire is faint.
 Figure 25. Each image shows a 2º rotation clockwise from the previous image. A spot light source contributes a small amount of fire (seen here as red, blue, green, or yellow virtual facets). As the gem is rotated, some virtual facets go from light to dark (examples are circled). As a facet nears the border between light and dark, the observer will see fire. Some of these flares of color last through larger degrees of rotation than others (larger red circles). While not illustrated, when a facet only slightly darkens or lightens, fire is faint. Strong changes in contrast create stronger fire. More fire is exhibited by materials of higher dispersion values.
Before implementing personal preferences, the faceter should be aware that the colored gem market is very focused on color: hue, saturation and tone. Color quality is critical, but often suffers in lightly colored gems when the design is modified toward brightness. Instead, optimization may be needed to enhance the color first and foremost, with scintillation a secondary priority. Understanding the elements of brightness can help the faceter achieve it without compromising color.
.jpg)


