Near-Colorless HPHT Synthetic Diamonds from AOTC Group
ABSTRACT
The gemological and spectroscopic properties of 52 colorless to fancy light-colored HPHT synthetic diamonds (40 of them colorless or near-colorless) produced by AOTC using either toroid- or BARS-press technologies were characterized. In addition to achieving excellent color grades, these commercially available faceted synthetics had a weight range of 0.05 to 0.80 ct, and possessed IF to I2 clarity. Their synthetic origin may be difficult to determine with standard gemological techniques alone, but they were conclusively identified using advanced testing methods, including photoluminescence, FTIR spectroscopy, and fluorescence imaging. Inclusions in two samples, grown by different press types, were studied using LA-ICP-MS. The trace-elemental analysis results indicated that the inclusions formed by the trapping of the solvent/catalyst melt during synthesis. Analysis of the combined multi-technique data provided insight into the identities of the solvents, catalysts, and nitrogen getters possibly used to grow high-quality HPHT synthetic diamonds.
Although well known in the colored diamond market, HPHT-grown synthetics have not played a significant role in the mainstream colorless diamond trade. Most colorless to near-colorless faceted HPHT synthetic specimens have been grown solely for research purposes by companies such as General Electric (Crowningshield, 1971; Koivula and Fryer, 1984; Shigley et al., 1993), De Beers (Rooney et al., 1993; Burns et al., 1999), and Sumitomo Electric Industries (Shigley et al., 1997; Sumiya and Satoh, 1996; Sumiya et al., 2002). Near-colorless HPHT synthetics have also been marketed within the gem trade, in notably limited quantities, by Chatham Created Diamonds, Starcorp, and Advanced Optical Technology Corporation (AOTC), now trading as AOTC Group, B.V. (see Koivula et al., 1994; Shigley et al., 1997; Deljanin et al., 2006; D’Haenens-Johansson et al., 2012).
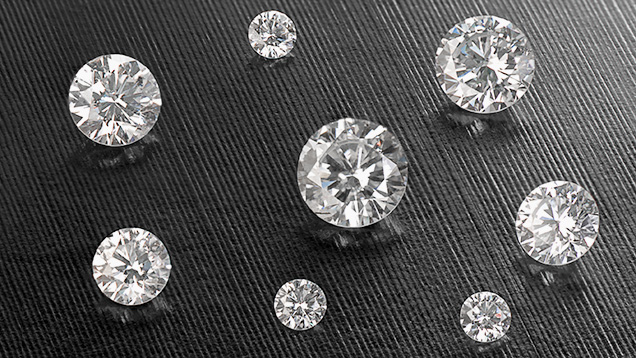
In 2012, three near-colorless and three faintly colored HPHT-grown AOTC synthetic diamonds were submitted to GIA’s New York laboratory for grading services. These samples, in addition to 24 colorless, near-colorless, faintly colored, and lightly colored faceted HPHT synthetics on loan from AOTC, were studied and briefly reported on in Gems & Gemology (D’Haenens-Johansson et al., 2012). GIA subsequently obtained another 22 samples from AOTC, including 10 melee-sized synthetic diamonds. This article will present the results of the investigation using gemological and spectroscopic techniques on the full suite of 52 AOTC synthetic diamonds (selected samples are shown in figure 1). Although their properties are comparable to those of top-quality natural diamonds, it is still possible to identify them as HPHT synthetics.
REVIEW OF HPHT SYNTHESIS OF DIAMOND
Diamond synthesis by HPHT methods was first carried out by the Swedish company ASEA in 1953, but the synthetic diamond era truly began a year later, when scientists at General Electric (GE) independently reported the growth of diamond using this technique (Bundy et al., 1955). Prior to GE’s success, diamond and graphite had already been established as carbon allotropes (i.e., consisting of different structural configurations of the same element). It was originally thought that applying high temperatures and pressures to graphite, to some extent mimicking the growth conditions of natural diamond, would yield synthetic diamond, but this proved unsuccessful.Through research, the process evolved into the temperature-gradient HPHT method. In this method (Bovenkerk et al., 1959), the HPHT capsule is filled with the carbon source material (typically graphite), a diamond “seed,” and a solvent/catalyst (usually a group VIII element such as iron or its alloys). The use of a solvent/catalyst lowers the temperature and pressure conditions necessary for successful diamond growth. Alloys such as Fe-Ni and Fe-Co are widely used because of their lower melting points (and thus lower pressures required). The system’s pressure and temperature are increased so that the solvent/catalyst melts; the resulting diamond is the thermodynamically stable form of carbon. The conditions vary depending on the size, quality, and type of diamond synthesized, but the pressures and temperatures applied are usually in the ranges of 5–6 GPa and 1300–1600°C, respectively (Burns et al., 1999). A temperature gradient (i.e., difference in temperature) is carefully produced, such that the carbon source material is located in a hotter region than the diamond seed. The source material dissolves, and the carbon atoms are transported toward the cooler region, where the dissolved carbon becomes supersaturated in the solvent, crystallizing on the diamond seed and forming new diamond. Four main types of presses are used to grow diamond by this method: belt, BARS (based on a split-sphere concept), cubic, and toroid presses (see e.g. Strong and Chrenko, 1971; Strong, 1989; Bundy et al., 1973; Shigley et al., 1993; Khvostantsev et al., 2004).
Chemical impurities and macroscopic inclusions from the solvent/catalyst are easily incorporated into the growing diamond. Nitrogen contamination may originate from the solvent/catalyst, the carbon source, or the gas found in the empty spaces or pores of the HPHT capsule. The nitrogen impurities enter the structure of the nascent diamond as substitutional atoms, resulting in yellow type Ib material with nitrogen concentrations in the range of 100 to 300 atomic parts per million (Burns et al., 1999). Most of the HPHT synthetic diamonds produced worldwide are type Ib. Synthesis time and temperature conditions permitting, the isolated nitrogen atoms may also aggregate into pairs, forming A-centers and resulting in mixed type Ib/IaA synthetic diamonds (Chrenko et al., 1971 and 1977).
To reduce impurity concentrations and create near-colorless type IIa or weak type IIb diamonds, it is insufficient to merely use higher-purity solvents/catalysts and carbon sources. It is also necessary to introduce a nitrogen getter, usually an element with a strong affinity for nitrogen, such as aluminum (Al), titanium (Ti), zirconium (Zr), or hafnium (Hf). A significant amount of the nitrogen in the growth capsule will thus be “trapped,” forming nitrides. Nevertheless, the introduction of the nitrogen getter may promote the uptake of solvent/catalyst inclusions, due to the reduced solubility of the carbon in the solvent/catalyst or changes in the diffusion of the carbon. To minimize this effect, it may be advantageous to slow the growth rate by adjusting the temperature. The nitrogen getter may also react with the carbon to form carbides that can be incorporated in the HPHT synthetic diamond, reducing its clarity. A suitable element (such as copper) may be further added to decompose these carbides (see Strong and Chrenko, 1971; Burns et al., 1990; Sumiya and Satoh, 1996; Sumiyu et al., 1996).
Type IIb synthetic diamonds with colors ranging from pale blue to opaque blue-black can also be created by doping the material with boron. To do this in a controlled manner, the nitrogen concentration is simultaneously reduced by adding nitrogen getters. The blue color arises from uncompensated boron, or the amount of boron in excess of the substitutional nitrogen concentration at the atomic ppm level (Burns et al., 1999).
Fancy-color HPHT synthetic diamond products, available to the gem trade since the early 1990s, have been extensively characterized (e.g., Shigley et al., 1993b, 2002). The complex mixture of ingredients in the growth capsule, combined with the need for sensitive control of temperature and pressure for extended periods of time, has made near-colorless HPHT diamond synthesis expensive and time consuming. Consequently, fewer near-colorless samples are available for study (Koivula et al., 1994; Shigley et al., 1997; Deljanin et al., 2006; D’Haenens-Johansson et al., 2012). AOTC indicates it can take more than two weeks to grow a synthetic “white” crystal that can be cut into a 1 ct synthetic diamond (D.NEA, 2014b). By comparison, AOTC states that growth periods for yellow and blue HPHT synthetic diamonds are 5–6 days and 7–10 days, respectively (D.NEA, 2014d,e). There is no post-growth treatment known to reduce color saturation in near-colorless HPHT synthetic diamonds, and AOTC claims to sell its “white” products in the as-grown state (D.NEA, 2014b). Although near-colorless HPHT synthetic diamond manufacturing for gem applications did not become commercially viable until recently, Sumitomo Electric Industries launched its Sumicrystal type IIa HPHT synthetic product in 1996. The company has reported the synthesis of diamonds as large as 8 ct for industrial applications (Sumiya and Satoh, 1996; Sumiya et al., 2002, 2005).
MATERIALS AND METHODS
All 52 of the faceted HPHT synthetic diamonds were round brilliants, ranging from 0.05 to 0.80 ct. Excluding the 10 melee-sized samples (all measuring 0.05 ct), the average weight was 0.37 ct. According to AOTC, 40 of the samples were grown using BARS presses, while the remaining 12 were created in toroid presses. Color and clarity grades were determined using the standard GIA grading systems for D to Z and fancy-color diamonds. Inclusions were investigated using a standard gemological binocular microscope system, as well as a Nikon SMZ1500 microscope with darkfield and fiber-optic illumination. The samples were also examined under magnification between two crossed polarizing filters to detect anomalous birefringence (usually caused by strain). The color and clarity grades given in this article are for research purposes only. GIA’s standard practice for synthetic diamond grading reports is to provide a color and clarity grade range.Electrical conductivity was tested using a GIA electroconductometer, and magnetic properties were evaluated by suspending the sample from a thin thread and checking for motion when a strong magnet was brought toward it (Koivula and Fryer, 1984).
The samples’ fluorescence and phosphorescence behavior to short- (254 nm) and long-wave (365 nm) ultraviolet light was investigated using a standard four-watt combination gemological testing lamp in a dark room. Additionally, fluorescence and phosphorescence images (5.0 second exposure and 0.1 second delay) were recorded using a DTC DiamondView instrument (230 nm excitation). Room-temperature phosphorescence spectra were collected using an Ocean Optics HR4000 spectrometer coupled with an Avantes-DH-S deuterium-halogen light source (215–2500 nm), as described by Eaton-Magaña et al. (2007, 2008). The experiment consisted of illuminating the sample for 20 seconds, switching off the light, and collecting phosphorescence spectra (1 second integration time) for a period of 120–180 seconds.
Room-temperature infrared absorption spectra were collected over the 6000–400 cm–1 range, at a resolution of 1 cm–1, using a Thermo Nicolet Nexus 6700 FTIR spectrometer equipped with KBr and quartz beam splitters and a DRIFT (diffuse-reflectance infrared Fourier transform) unit. The system was purged with nitrogen gas to reduce absorption features from atmospheric water and carbon dioxide. IR spectra were normalized using the method of Palik (1985) to allow for calculation of defect concentrations.
Photoluminescence (PL) spectra were collected using a Renishaw InVia Raman confocal microspectrometer equipped with four laser systems, producing six excitation wavelengths: 324.8, 457.0, 488.0, 514.5, 632.8, and 830.0 nm. Samples were immersed in liquid nitrogen in a specially designed double-layer bath (patent pending) to maintain temperature at 77K (–196°C). Additional PL data were acquired using a Horiba XploRA Raman confocal microspectrometer with a 532.0 nm laser.
Trace-element analysis was conducted on surface-reaching inclusions in two samples, B0124 and T0130 (BARS- and toroid-press grown, respectively), using a ThermoFisher X-Series II laser ablation–inductively coupled plasma–mass spectrometer (LA-ICP-MS) equipped with a 213 nm laser ablation system. NIST SRM 610 and 612 glass standards were used for internal calibration. The system was run with a 7 Hz repetition rate and 16.09 J/cm2 fluence. Spot sizes of 25 mm (B0124) or 30 mm (T0130) were chosen to ensure that only the inclusion material was sampled. The inclusions in B0124 and T0130 were laser-ablated for 45 and 30 seconds, respectively.
RESULTS
Color. As shown in table 1, most of the samples were graded as colorless in the D–F range (33%) or near-colorless in the G–J range (44%). Notably, the largest specimen (B0141, weighing 0.80 ct) had an impressive G color grade. The remaining samples displayed enough blue, green, or yellow-green coloration to begraded on the fancy color scale, with the strongest color saturation resulting in a Fancy Light blue grade. The color distribution in the latter samples was unusually even, without the zoning frequently observed in HPHT synthetics.| Table 1. Gemological properties and calculated bulk concentrations of neutral boron ([B0]) impurities for HPHT synthetic diamonds from AOTC.a | |||||||
|
a[B0], averaged across the whole sample, was calculated using the integrated intensity of the 2800 cm–1 feature in the FTIR absorption data. N/A: not analyzed. |
|||||||
| Sample | Growth apparatus | Weight (ct) | Color | Clarity | Magnetic | Electrically conductive | [B0] bulk concentration (ppb) |
| B0117 | BARS | 0.22 | Faint Blue | VS2 | No | Yes | 38 ± 5 |
| B0118 | BARS | 0.34 | F | VVS2 | No | No | - |
| B0119 | BARS | 0.28 | F | VS1 | No | No | 8 ± 1 |
| B0120 | BARS | 0.30 | Fancy Light blue | VS2 | Yes | Yes | 216 ± 30 |
| B0121 | BARS | 0.26 | F | VS2 | Yes | No | 3.2 ± 0.5 |
| B0122 | BARS | 0.38 | Very LIght blue | SI2 | Yes | No | 62 ± 9 |
| B0123 | BARS | 0.39 | H | I1 | No | Yes | 21 ± 3 |
| B0124 | BARS | 0.41 | G | VS2 | Yes | No | 7 ± 1 |
| B0125 | BARS | 0.42 | H | SI1 | Yes | Yes | 47 ± 7 |
| B0126 | BARS | 0.45 | Very Light blue | SI1 | Yes | Yes | 57 ± 9 |
| B0127 | BARS | 0.54 | J | VS1 | No | No | 4.7 ± 0.7 |
| B0128 | BARS | 0.57 | J | VVS1 | No | No | 12 ± 2 |
| T0129 | Toroid | 0.20 | H | I1 | No | No | — |
| T0130 | Toroid | 0.33 | H | I2 | Yes | No | — |
| T0131 | Toroid | 0.32 | I | I2 | Yes | No | — |
| T0132 | Toroid | 0.32 | G | I2 | Yes | No | — |
| T0133 | Toroid | 0.21 | H | VS2 | No | No | — |
| T0134 | Toroid | 0.21 | I | VVS1 | No | No | — |
| T0135 | Toroid | 0.23 | I | VVS1 | No | No | — |
| T0136 | Toroid | 0.23 | F | I1 | Yes | No | — |
| T0137 | Toroid | 0.25 | G | I2 | Yes | No | — |
| T0138 | Toroid | 0.25 | F | I2 | Yes | No | — |
| T0139 | Toroid | 0.25 | G | I1 | Yes | No | N/A |
| T0140 | Toroid | 0.27 | J | I1 | Yes | No | — |
| B0141 | BARS | 0.80 | G | VVS1 | N/A | N/A | 49 ± 7 |
| B0142 | BARS | 0.60 | F | IF | N/A | N/A | — |
| B0143 | BARS | 0.58 | H | I1 | Yes | No | — |
| B0144 | BARS | 0.51 | Very Light green | SI1 | Yes | No | 94 ± 15 |
| B0145 | BARS | 0.46 | F | SI1 | Yes | No | 25 ± 4 |
| B0146 | BARS | 0.40 | E | SI1 | Yes | No | 21 ± 3 |
| B0147 | BARS | 0.40 | F | SI1 | Yes | No | 13 ± 2 |
| B0148 | BARS | 0.31 | Very Light yellowish green | VS1 | No | No | 17 ± 3 |
| B0149 | BARS | 0.30 | G | VS2 | Yes | No | 32 ± 5 |
| B0150 | BARS | 0.30 | Faint blue | VVS1 | Yes | No | 26 ± 4 |
| B0151 | BARS | 0.29 | G | SI2 | Yes | No | 13 ± 2 |
| B0152 | BARS | 0.24 | Faint yellow-green | VVS1 | No | Yes | 4.3 ± 0.6 |
| B0153 | BARS | 0.05 | F | VVS1 | No | No | 47 ± 7 |
| B0154 | BARS | 0.05 | H | VVS1 | No | No | — |
| B0155 | BARS | 0.05 | E | VVS1 | No | No | 30 ± 5 |
| B0156 | BARS | 0.05 | Faint blue | VVS1 | No | Yes | 120 ± 20 |
| B0157 | BARS | 0.05 | D | VVS2 | No | No | 49 ± 7 |
| B0158 | BARS | 0.05 | I | VVS2 | No | No | — |
| B0159 | BARS | 0.05 | E | VVS1 | No | No | 25 ± 4 |
| B0160 | BARS | 0.05 | E | IF | No | No | 31 ± 5 |
| B0161 | BARS | 0.05 | F | VVS1 | No | No | 100 ± 15 |
| B0162 | BARS | 0.05 | E | IF | No | No | 23 ± 3 |
| B4122 | BARS | 0.57 | G | VS1 | No | No |
4.1 ± 0.6 |
| B4123 | BARS | 0.54 | F | VVS1 | No | No | 2.6 ± 0.4 |
| B4124 | BARS | 0.50 | Very Light blue | VS2 | Yes | Yes | 90 ± 10 |
| B4125 | BARS | 0.42 | Faint blue | SI1 | Yes | Yes | 42 ± 6 |
| B4126 | BARS | 0.35 | H | SI1 | Yes | No | — |
| B4127 | BARS | 0.33 | Faint blue | SI1 | Yes | Yes | 36 ± 5 |


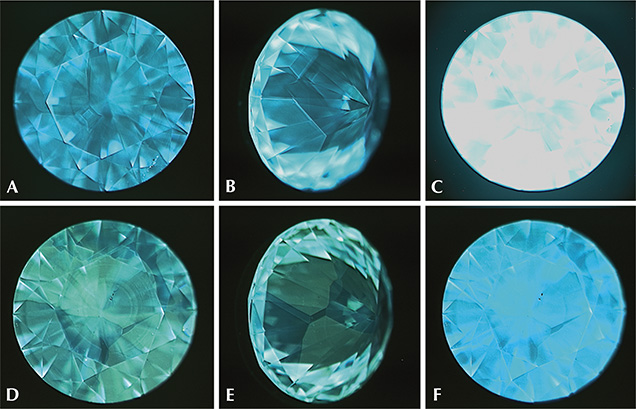
DiamondView fluorescence images revealed cuboctahedral growth patterns typical of HPHT synthetics. The patterns form due to growth sector–dependent differences in a sample’s impurity uptake, where a growth sector is defined as a three-dimensional region of the crystal with a common crystallographic growth plane (Burns et al., 1990, 1999). At times the contrast between adjacent fluorescing sectors was weak, and viewing such samples along multiple directions greatly aided in distinguishing the patterns. The bulk fluorescence was either blue or green, and the samples had strong blue phosphorescence, as illustrated in figure 4.
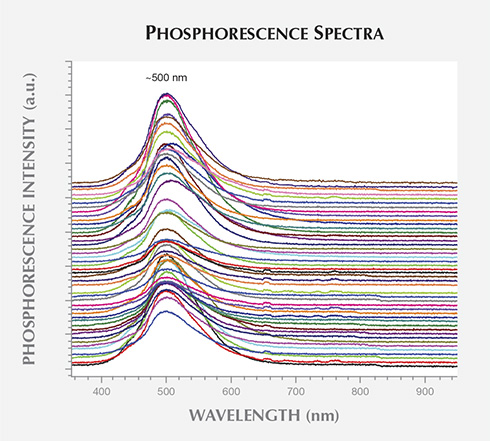
diamonds showed strong emission at approximately 500 nm. The spectra have been
vertically translated for clarity.
Electrical Conductivity. Electrical conductivity, occurring with white luminescence, was detected in some of the colored or lower-grade near-colorless samples, representing 17% of all the specimens tested (table 1). The conductivity measurements were found to depend on the positioning of the electrical probes on the samples. Some of the samples reported as not conductive, therefore, may have actually had conducting regions that were not accessed due to geometry or volume conditions. Electrical conductivity can indicate the presence of boron in diamond. The presence of boron turns pure insulating diamond into a conductive material. The solubility of boron is growth-sector dependent, and previous studies of boron-containing diamonds have shown that concentrations can vary in orders of magnitude across different growth sectors of the same specimen, with the highest concentrations usually found in {111} sectors. Yet the sector with the highest boron concentration has also been reported to be strongly influenced by the degree of doping (Burns et al., 1990). Hence, it is not surprising that boron-containing HPHT synthetic diamonds have sector-dependent electrical conductivity (Rooney et al., 1993; Shigley et al., 1997).
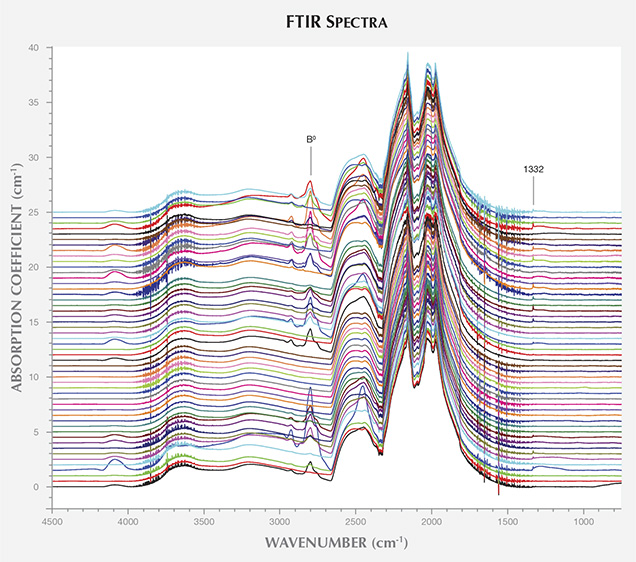
A weak peak at 1332 cm–1 was observed in 37 of the 40 BARS samples. Due to the high density of phonon states in this region, the identity of the 1332 cm–1 peak is uncertain, though it has been observed in boron-doped diamonds and in synthetic diamond grown using nickel-containing solvent/catalyst (Collins et al., 1990a; Lawson and Kanda, 1993; Lawson et al., 1998). The FTIR spectrum for the positively charged state of the substitutional nitrogen center (NS+) is characterized by a peak at 1332 cm–1 and broad features at 1046 and 950 cm–1 (Lawson et al., 1998). As the latter two features were not observed in the AOTC samples’ spectra, the 1332 cm–1 peak could not be attributed to this defect. Nor was the neutral charge state of substitutional nitrogen, NS0, which produces a peak at 1344 cm–1, detected in any of the spectra (Lawson et al., 1998).
Photoluminescence. PL spectroscopy at liquid-nitrogen temperatures revealed no single peak in all of the samples, even though several contained similar defects (identified by their characteristic emission peaks). Since it was possible to excite emission from certain defects using multiple lasers, they will be described here for the lasers that caused the most efficient excitation (figures 7–10). In general, the observed emission peaks were weak, and could only be detected when the power was high enough to saturate the diamond Raman peak.
Nitrogen-vacancy center (NV0/–) concentrations were sufficiently high in 33 of the 52 total samples to produce detectable zero-phonon lines (ZPLs) at 575 nm (2.156 eV, neutral charge state) or 637 nm (1.945 eV, negative charge state) with 514.5, 532.0, or 488.0 nm laser excitations. In the 514.5 nm PL spectra, the 637 nm ZPL was more intense than the 575 nm ZPL for 64% of the samples showing these emissions (see figures 7A–D). These spectra also revealed weak unidentified peaks at 658.0 nm (1.884 eV) in 19 of the samples and at 675.2 nm (1.836 eV) in 9 samples (37% and 17%, respectively). Additionally, a set of faint emission lines at 706.9, 709.1, and 712.2 nm (1.754, 1.748, and 1.741 eV) was observed in 12 of the samples (23%). It is unknown whether these are related.
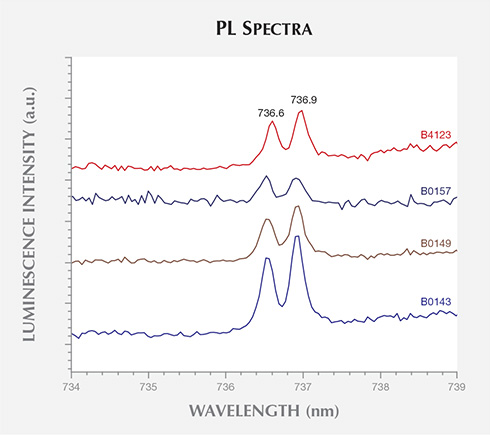
PL spectra for four samples using 632.8 nm laser excitation. Spectra have been translated
vertically for clarity.
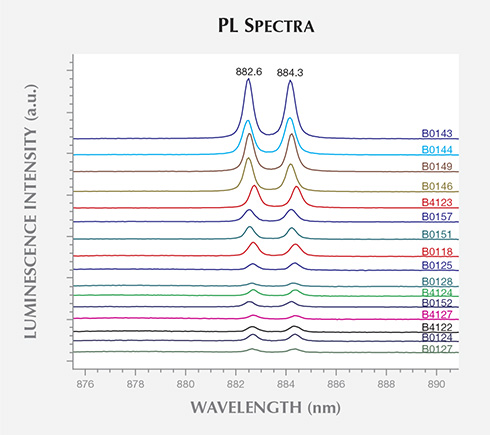
(830.0 nm laser excitation) collected for the BARS samples. These representative spectra
have been translated vertically for clarity.
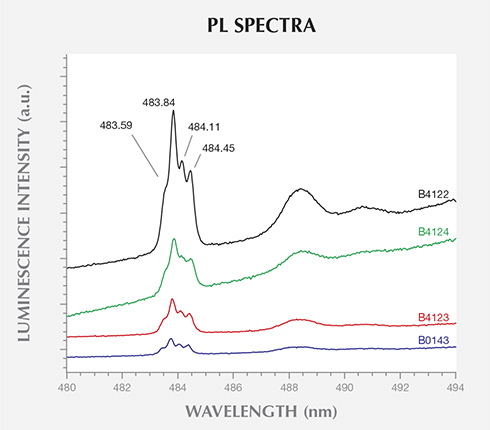
detected in the PL spectra (324.8 nm laser excitation) of 10 of the 40 BARS-grown samples.
Only the most intense and clearly resolved spectra are presented here, translated vertically
for clarity.
LA-ICP-MS. The LA-ICP-MS data collected on the surface-reaching inclusions of samples B0124 and T0130, thought to be remnants of the solvents/catalysts used during growth, provided clues to their growth capsule constituents. B0124 and T0130 were synthesized using BARS- and toroid-press technologies, respectively. The raw data are presented in figure 11, where the number of counts detected for certain elements were monitored as a function of time: before, during, and after the inclusion was vaporized by the laser. It is important to note that the sensitivity of LA-ICP-MS to different elements is not uniform, so these plots should not be compared for distinct elements. Conventionally, quantitative concentration analysis can be achieved by comparing the intensity of the detected counts for each element with that for a reference sample with known, calibrated element concentrations. The large variance (at times multiple orders of magnitude) in the concentration of different elements between the inclusions and the reference samples introduced uncertainties significant enough that quantitative analysis of relative concentrations was not deemed suitable. Nevertheless, the LA-ICP-MS data proved reliable in determining the presence of certain elements in the inclusion.
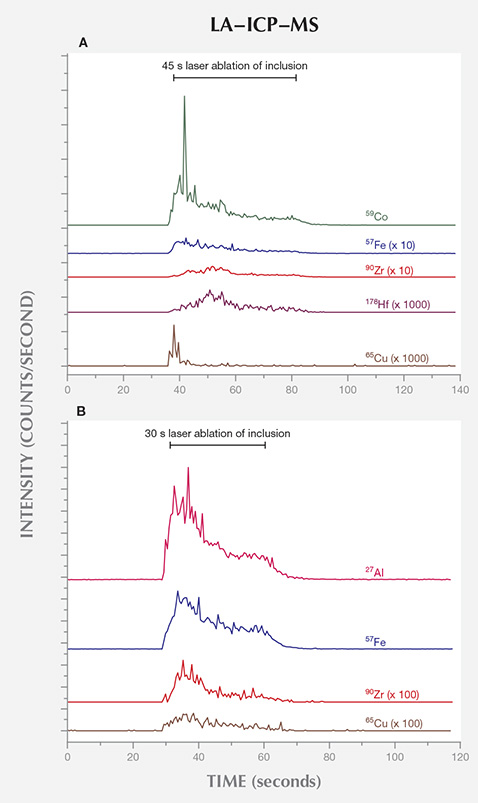
were grown using BARS- and toroid-press technologies, respectively. The traces have
been scaled and vertically translated for clarity.
DISCUSSION
Improvements by AOTC in Gem-Quality HPHT Synthetic Diamonds. The growth of colorless HPHT synthetic diamonds for faceting on a commercial scale has proven extremely complex. The primary challenges have been to exclude readily incorporated nitrogen impurities, while simultaneously achieving acceptable growth rates and minimizing the incorporation of the solvent/catalyst melt, which forms unattractive inclusions. Sophisticated presses with accurate long-term temperature and pressure controls are necessary, in conjunction with a carefully selected combination of carbon source, nitrogen getter, and solvent/catalyst. Previous efforts to manufacture similarly colored material by this method have been limited by technological or economic constraints; successful fabrication has been done primarily for research purposes or niche industrial applications (Crowningshield, 1971; Rooney et al., 1993; Shigley et al., 1993, 1997; Sumiya and Satoh, 1996; Sumiya et al., 2002).The overall quality of the AOTC samples was remarkably high, with 77% of the suite assigned colorless to near-colorless grades. Furthermore, the specimens reached sizes that are popular with the jewelry consumer, with the largest sample weighing 0.80 ct. Clarity, which ranged from IF to I2, was typically affected by the presence of dark inclusions originating from the solvent/catalyst melt. The clarity grades did not strictly correlate with size or color, though the melee-size specimens were generally of higher clarity. Overall, the clarities seen in these colorless and near-colorless HPHT synthetics are considerably better than most previous products. This combination of color, size, and clarity makes the AOTC products, on first inspection, comparable to natural and CVD synthetic diamonds on the market.
Characterization using PL, FTIR absorption, and LA-ICP-MS has provided a body of data that allows us to speculate about the identity of some key chemical components present during the HPHT synthesis of the samples and comment on the resulting gemological characteristics. FTIR data demonstrated that most of the BARS-press synthetics contained extremely low levels of boron impurities and no detectable levels of isolated nitrogen defects. The low concentration of nitrogen defects indicates the use of a nitrogen getter during growth. The yellow color often associated with HPHT synthetic diamonds arises from typically high concentrations of neutrally charged substitutional nitrogen. Neutral substitutional nitrogen was not detected in the AOTC samples, which explains the absence of a yellow hue. On the other hand, the neutral boron that was detected can introduce a blue hue. The color ultimately achieved is affected by not only the concentration of the different color-producing defects, but also by the diamond’s volume and faceting arrangement. Overall, synthetic diamonds with low boron concentrations were likely to appear colorless to near-colorless, while the samples with higher boron concentrations tended to show enough saturation of blue color to be graded using the fancy color scale. In all likelihood, a combination of color-producing defects was responsible for the non-blue colors observed in a small subset of the samples.
PL spectroscopy revealed that 70% of the samples grown using BARS presses contained Ni-related impurities. Ni is frequently used in the solvent/catalyst mixture, as it reduces the temperature and pressure conditions needed for diamond synthesis. Conversely, there was no evidence for the incorporation of Ni in any of the samples produced by toroid presses. This suggests the use of a different solvent/catalyst mixture for the two press types. Unfortunately, PL-active defects produced by Fe or Co, elements that are often constituents of the solvent/catalyst, have not yet been identified in as-grown HPHT synthetic diamond. While a few Co-related PL features have been reported in annealed synthetic diamonds, they were limited to samples with significant nitrogen contamination (Lawson et al., 1996). The AOTC samples had nitrogen concentrations below the FTIR spectrometer’s detection limit and reportedly have not undergone post-growth treatment (D.NEA, 2014b). Hence, PL cannot be used to confirm or rule out the presence of Fe or Co. It is unknown whether the presence of SiV– in the PL spectra for four of the BARS-press samples arose from intentional Si-doping, but the low concentration suggests that it resulted from contamination.
Notably, the samples produced by toroid presses showed uncommonly faint and limited features in their PL spectra. This result, combined with the absence of detectable defect-related absorption in their FTIR spectra, suggests that AOTC has exerted more control over impurity incorporation in its toroid-press production. These samples, however, were more likely to contain significant inclusions from the solvent/catalyst melt.
LA-ICP-MS analysis of inclusions in samples grown using the two different press types revealed additional information. Although only two samples were analyzed, and caution must be taken when extrapolating the results to AOTC’s entire commercial production, the gemological and spectroscopic properties were consistent with the remaining samples from the two press types. The inclusions’ chemical composition provides strong indications about the solvent catalysts and nitrogen getters used during synthesis in the two different presses. Our chemical data suggest that the BARS press employed some combination of Fe, Co, and Ni in the solvent catalyst; Zr and Hf as nitrogen getters; and Cu to reduce inclusions. For the toroid press, we saw evidence of the addition of Zr and Al as nitrogen getters and Cu to reduce inclusions, but it remains unclear what other elements besides Fe constituted the solvent catalyst. If present, Co and Ni were likely much lower in concentration in the toroid growth process. Additional analysis is necessary to constrain this further.
Identification Features. Similar to previous reports on HPHT synthetic diamond from other manufacturers, certain visual characteristics can be used to characterize the AOTC samples as HPHT synthetic, although advanced testing is necessary for conclusive identification. Due to the high color grades of the AOTC product, visual inspection did not reveal patterned color zoning arising from their cuboctahedral growth morphology. Under magnification, unusual elongated, dark metallic solvent/catalyst inclusions, similar to those often seen in other HPHT synthetic diamonds, were observed in some samples. If heavily included, the AOTC synthetics were also attracted to a strong magnet, confirming the presence of ferrous material not associated with natural diamonds. The shape and metallic appearance of the inclusions are an extremely rare combination in natural diamonds, and should therefore arouse suspicion (Sobolev et al., 1981). When viewed between crossed polarizers, AOTC’s HPHT synthetics also showed remarkably low levels of strain without a discernible pattern. This is in contrast to natural diamonds, which typically show cross-hatched “tatami,” banded, or mottled strain patterns.
Illumination with a standard gemological UV lamp produced a yellowish green fluorescence and phosphorescence to short-wave UV, while the samples were inert to long-wave UV. The stronger response to short-wave UV is the opposite of the reaction observed for most natural diamonds (Shigley et al., 1993). The intense, long-lasting phosphorescence induced in some of the AOTC synthetics is seldom observed in natural diamonds and should alert the gemologist to the need for more detailed analysis. Fancy-color HPHT synthetic diamonds often display a fluorescence zoning arising from the variation in the uptake of impurities for the different growth sectors. In this study, the contrast was too low to be detected using a handheld UV lamp. Only the high-energy UV excitation and magnification-enabled imaging of the DiamondView instrument revealed the cuboctahedral growth patterns characteristic of HPHT synthetics.
FTIR spectra characterized the AOTC synthetic diamonds as type IIa/IIb, without any features exclusive to HPHT synthetics. Since the majority of natural near-colorless diamonds are type IaA, however, all type IIa or IIb samples should be treated with caution and subjected to additional testing. PL spectroscopy was able to demonstrate the presence of Ni-related impurities in most of the BARS-press samples, which displayed distinctive lines at 882.6/884.3 nm and a band of four lines centered at about 484.0 nm. It is important to note that Ni-related defects are rarely detected in natural diamonds (Nobel et al., 1998; Chalain, 2003; unpublished GIA research), and their presence should immediately raise suspicion. Significantly, these features were absent in the PL spectra of AOTC’s toroid-press synthetic diamonds.
Other useful peaks at 658.0, 675.2, 706.9, 709.1, and 712.2 nm were seen in some samples, from both BARS- and toroid-type presses. These peaks have not previously been reported and are thus promising for identification purposes. The detection of the SiV– optical center at 736.6/736.9 nm in four AOTC samples, in addition to a number of natural and HPHT-grown synthetic diamonds (Breeding and Wang, 2008; Moe and Wang, 2010; Wang and Moe, 2012), emphasizes that this feature should not be considered proof of CVD synthesis. Overall, the high purity levels of the AOTC synthetics resulted in PL features that were usually much weaker than the diamond Raman peak, requiring a high-sensitivity spectrometer for detection.


.jpg)


