
ABSTRACT
Glass-ceramics are materials consisting of crystalline phases dispersed in an amorphous glassy matrix, produced by the controlled nucleation of forming crystallites from the molten glass host. With characteristics of both glasses and ceramics, they can be created in any color and transparency and in a wide array of refractive indices depending on their composition, making them ideal for use as imitation gemstones. Accurate identification requires a combination of standard and advanced gemological testing, using instruments available in major gemological laboratories. For glass-ceramics with a composition dominated by silicon, aluminum, magnesium, and zinc, the most effective identification method combines refractive index, major chemical composition, and photoluminescence and infrared absorption data. Key characteristics of this material include: a single refractive index between 1.60 and 1.63; an unusual combination of elements—mainly silicon, aluminum, magnesium, zinc, titanium, and zirconium—determined through bulk analysis with energy-dispersive X-ray fluorescence spectroscopy; infrared absorption bands around 3380 and 3440 cm–1 (which are absent in natural and manufactured glass); and a photoluminescence spectrum resembling that of spinel-group minerals. The properties of silicon-aluminum-magnesium-zinc glass-ceramics are consistent across the range of colors and transparencies.
At first, the concept of glass-ceramics might sound counterintuitive. Glasses are an amorphous solid lacking any crystal structure, while ceramics are typically composed of fine-grained crystallites fused together. Glass-ceramics combine characteristics of both, resulting in good mechanical strength, thermal shock resistance, and zero porosity or permeability, making them very suitable for gem and jewelry applications (figure 1).
This study examines the nature of glass-ceramic material and its use as an imitation gem, focusing on identification criteria for glass-ceramics of a specific chemical composition—silicon-aluminum-magnesium-zinc—to distinguish these from natural and laboratory-grown gemstones as well as glass imitations.
BACKGROUND
Glass-ceramics are inorganic, nonmetallic materials that start as a glass and, through controlled nucleation, form fine crystalline grains evenly dispersed in the glassy matrix. Within a glass-ceramic, the volume percentage of crystalline phases is wide ranging and can vary from nearly 100% to less than 0.0001% (Deubener et al., 2018). Glass-ceramics have been used for decades in many industries, largely for their combination of mechanical strength and heat resistance (Höland and Beall, 2020). A familiar example is the glass-ceramic cooktop on induction stoves found in many kitchens. This surface is designed to withstand high heat and thermal shock, as well as constant impact from pots and pans.
For gem and jewelry applications, glass-ceramic materials are engineered to contain elements that act as chromophores to impart a desired color and highly uniform color distribution. A virtually unlimited array of hues, saturations, and transparencies can be created with the addition of certain trace elements. Glass-ceramics exhibit high heat tolerance, which facilitates their use in large-scale jewelry manufacturing processes. Most common gems (natural, laboratory-grown, and imitation) must be manually set after metal mountings are cast, because the temperatures required during casting exceed the gems’ heat tolerance; setting them during the casting process would result in mechanical failure and color fading of the stones. Glass-ceramics, with their high heat tolerance, can be used in a direct casting process without losing their color. These physical properties make the material particularly suitable for use in jewelry (Vyshnevskyi et al., 2017; Dymshits and Zhilin, 2017). Nonetheless, significant development of glass-ceramics for the jewelry industry only started about a decade ago.
Glass-ceramics are conducive to large production volumes and high yields of finishable material, resulting in very low costs for finished goods—often retailing for less than US$1 per carat. This combination of affordability, variety and versatility, and ease of manufacturing makes them an attractive option for mass-produced costume jewelry.
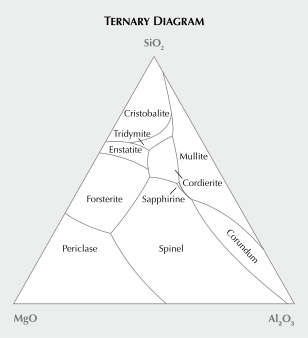
This article will refer to the initial glass (prior to the development of internal crystalline phases) as “optical glass” to clearly differentiate it from the final glass-ceramic material. The phase diagram of silicon-aluminum-magnesium oxides shown in figure 2 approximates the composition of glass-ceramics in this study. In producing glass-ceramics, internal crystallization is carefully controlled with respect to temperature and duration, and the process is stopped before crystallization is brought to completion. Complete crystallization would result in the cordierite phase, (Mg,Fe)2Al4Si5O18. This controlled process yields various crystalline phases within glass-ceramics, most notably spinel (MgAl2O4). Adding significant concentrations of zinc oxide to the mixture can produce glass-ceramics based primarily on spinel crystals, ranging from traditional spinel (MgAl2O4) to gahnite (ZnAl2O4) (Pinckney and Beall, 1997; Beall and Pinckney, 1999). In glass-ceramics of the silicon-aluminum-magnesium-zinc oxide system, titanium and/or zirconium oxides are also added to act as heterogeneous nucleating agents (Höland and Beall, 2020). See box A for more details on the creation of glass-ceramics.
BOX A: PRODUCING GLASS-CERAMICS FOR GEM AND JEWELRY APPLICATIONS
A team of GIA scientists observed the full process of creating glass-ceramics, from raw material to finished gems, at Formica’s plant in Thailand in August 2024. These steps are outlined below.
First, the required chemicals are mixed thoroughly in large batches, each exceeding 40 kg. The bulk of the mixture consists of oxides of the major elements that make up the glass (silicon, aluminum, magnesium, and zinc). Oxides of zirconium and titanium are also added and serve as nucleating agents in aluminosilicate glasses, triggering the (controllable) formation of crystalline phases (Beall and Pinckney, 1999; DeCeanne et al., 2022). A specific combination of color-causing elements is also added to the mixture, ranging from just a few ppm up to 3% by weight. The exact ratios are important for the color of the final product.
After mixing, the powder is loaded into a large crucible and heated to a very high temperature while stirred continuously, resulting in a melt with the same composition as the original mixture. The molten glass is then poured into a slab (the added zinc helps lower viscosity at this stage) and cooled under a controlled temperature gradient. This gradual cooling prevents not only unwanted crystallization of certain minerals, but also thermal shock that could lead to mechanical defects during this stage.
When the glass cools to room temperature, it goes through quality control to remove any areas containing trapped gas bubbles—it is still a glass during this stage—or cloudy areas caused by unwanted crystallization. Only the clearest glass moves on to the next stage. The rejected material can be remelted and poured again or reused in subsequent batches.
In the final stage, the glass is placed in another furnace and subjected to a heating and cooling regime that determines the degree of crystallization. This in turn determines the final color and transparency of the glass-ceramic.
The final product can be manufactured just like any other gemstone or ornamental stone, through cutting, polishing, cabbing, sawing, or carving.
MATERIALS AND METHODS
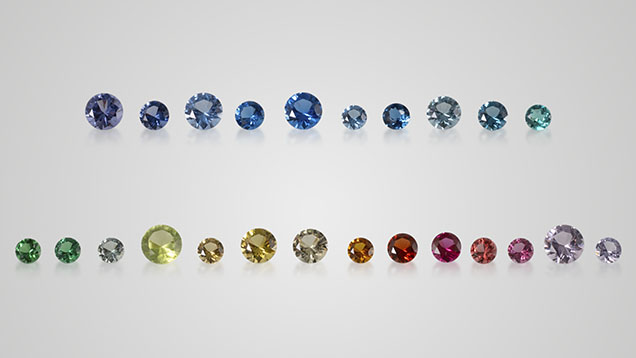
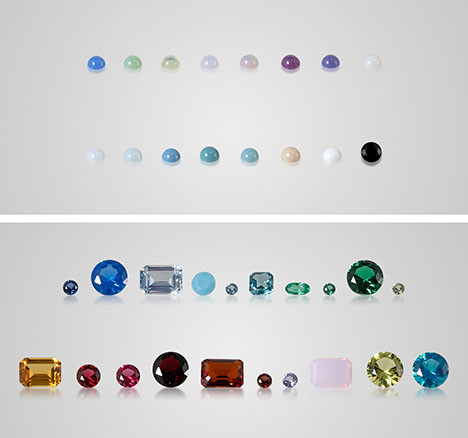
Samples. Two sets of glass-ceramic imitation gemstones, 60 samples in all, were investigated for this study. The first set (GC-01 to GC-40), produced and donated by the Formica Group, consisted of 24 transparent round brilliants (again, see figure 1) and 16 translucent to opaque cabochons (figure 3, top) in a wide range of colors and weighing between 0.10 and 0.47 carats. The second set (GC-101 to GC-120), an additional 20 glass-ceramic imitation gemstones with compositions similar to the first set, was purchased by the authors (figure 3, bottom). The manufacturer of these samples is unknown. They had various colors, shapes, and transparencies, weighing between 0.03 and 1.13 carats. See table S1 in the supplementary material for descriptions of individual samples.
For comparison, three optical glasses (OG-01 to OG-03) used to create green, blue, and red transparent glass-ceramics were also analyzed (see table 2). These were donated by the Formica Group.
Methods. In the field of materials science, glass-ceramics have been well studied, as evidenced by the many publications on this topic. These studies relied on methods for analyzing the crystalline phase development in the materials, such as X-ray diffraction, electron microscopy, and differential thermal analysis (Liu et al., 2018; Höland and Beall, 2020). However, these methods are generally not available in gemological laboratories.
To develop identification criteria for glass-ceramics of the silicon-aluminum-magnesium-zinc system from the perspective of gemologists, the glass-ceramics and the optical glass samples were examined at the GIA laboratory in Bangkok using the following analytical techniques.
Standard Gemological Testing. Standard gemological properties were recorded on all samples. Refractive index (RI) was measured with a GIA-built refractometer, and specific gravity (SG) was determined by the hydrostatic method. A polariscope was used to determine whether the samples were singly refractive, doubly refractive, or uniaxial in optic character. A standard UV lamp with long-wave (365 nm) and short-wave (254 nm) excitation was used to observe fluorescence reaction. Microscopic examination was conducted at 10× to 60× magnification, using darkfield, brightfield, diffused, and fiber-optic illumination.
Fourier-Transform Infrared (FTIR) Spectroscopy. FTIR absorption spectra of all samples were recorded using a Thermo Nicolet iS50 FTIR spectrometer equipped with an XT-KBr beam splitter, a cryogenic MCT detector, and a DRIFTS accessory for cut glass-ceramics or a 4× beam condenser accessory for the optical glasses. The resolution was set at 4 cm–1.
Ultraviolet/Visible/Near-Infrared (UV-Vis-NIR) Spectroscopy. UV-Vis-NIR absorption spectra of the transparent samples (GC-01 to GC-24, GC-101 to GC-103, GC-105 to GC-117, GC-119, and GC-120) were collected using a GIA custom-built UV-Vis-NIR system. The system included a DH-2000-BAL Ocean Optics deuterium and halogen light source, a QE Pro high-performance spectrometer, and a bifurcated fiber-optic probe for routing UV-Vis-NIR radiation from the light source to the sample and collecting its transmitted signal. Spectra were collected from 300 to 980 nm with an integration time of 1000 ms and one accumulation.
Photoluminescence (PL) Spectroscopy. PL spectra of all samples were collected at room temperature using a Renishaw inVia Raman microscope fitted with a 514 nm laser, 1800 lines/mm grating, and a 5× objective lens. The spectra were recorded between 520 and 850 nm.
Energy-Dispersive X-Ray Fluorescence (EDXRF) Spectroscopy. EDXRF spectra of all samples were collected for qualitative elemental analysis using a Thermo Quant’X EDXRF spectrometer, operating at 20 keV without a filter. The spectra were recorded between 0 and 20 keV.
Laser Ablation–Inductively Coupled Plasma–Mass Spectrometry (LA-ICP-MS). Trace element concentrations were measured quantitatively in all samples using LA-ICP-MS. Analyses were performed with a Thermo Fisher Scientific iCAP Q ICP-MS coupled with a Q-switched Nd:YAG laser ablation device operating at a wavelength of 213 nm. Faceted samples were analyzed on the girdle, while cabochons were analyzed close to the base. Laser ablation was carried out using 55 μm diameter spots, with a fluence of around 10 J/cm2 and a 10 Hz repetition rate. The dwell time for each spot was 40 seconds. The ICP-MS was operated at a forward power of 1350 W, with a typical nebulizer gas flow of about 0.80 L/min. External calibration was performed using National Institute of Standards and Technology (NIST) 610 and U.S. Geological Survey glasses GSD-1G and GSE-1G as reference standards. The analyzed isotopes included 23Na, 24Mg, 27Al, 29Si, 43Ca, 47Ti, 53Cr, 55Mn, 57Fe, 59Co, 60Ni, 63Cu, 66Zn, 88Sr, 89Y, 90Zr, 118Sn, 137Ba, 139La, 140Ce, 141Pr, 146Nd, 147Sm, 157Gd, 166Er, 174Hf, and 197Au.
RESULTS
The studied glass-ceramics generally showed consistent gemological properties, FTIR and PL spectra, and major chemical compositions, regardless of color and transparency (again, see the supplementary material). All were singly refractive, with RIs between 1.60 and 1.63, and hydrostatic SGs ranged between 2.85 and 3.42. Polariscope testing usually revealed single refraction, with occasional anomalous double refraction. A uniaxial optic character could be observed in some translucent samples. Most samples were inert under long-wave UV fluorescence but appeared chalky white, blue, or green under short-wave UV.
Microscopic examination revealed that the transparent stones were relatively clean, with uniform color distribution throughout. The inclusions in transparent samples were limited to minute gas bubbles, straight internal graining, and conchoidal fractures. Some of the transparent samples had light cloudy patches that were visible with fiber-optic illumination, while the translucent ones usually appeared milky throughout. In addition, semitranslucent blue samples (GC-35 and GC-37) appeared red when observed with transmitted light.
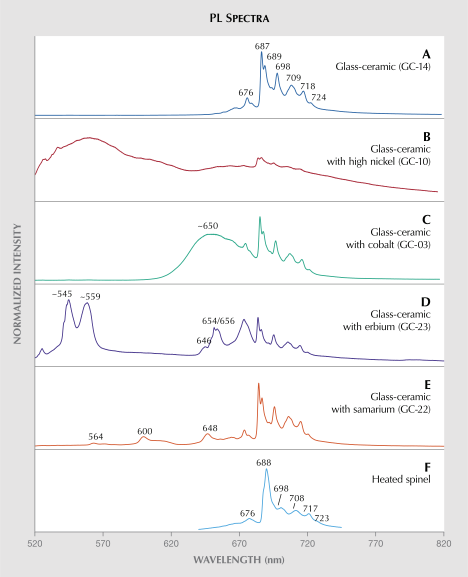
PL spectra of the glass-ceramics generally showed several emission peaks between 670 and 730 nm (figure 4). The main peaks were a doublet at 687 and 689 nm, with minor peaks at 676, 698, 709, 718, and 724 nm. Certain samples displayed additional PL features, such as a broad emission band at approximately 650 nm, or two emission peaks at around 545 and 559 nm. The series of peaks between 670 and 730 nm was not detected in three opaque samples—GC-35 (blue), GC-36 (greenish blue), and GC-40 (black)—or in transparent samples GC-119 (bluish green) and GC-120 (yellowish green).
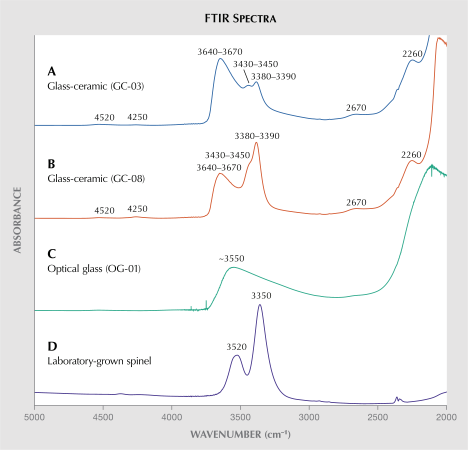
FTIR spectra of the silicon-aluminum-magnesium-zinc glass-ceramic samples were generally consistent (figure 5), with three main broad absorption bands at ~3640–3670 cm–1, 3430–3450 cm–1, and 3380–3390 cm–1. These results align with previous reports (Shen, 2010; Srisataporn et al., 2022). FTIR spectra of the studied glass-ceramics can be separated into two patterns. The majority of the samples (about 70%) showed a prominent band at 3640–3670 cm–1, with weaker bands at 3430–3450 cm–1 and 3380–3390 cm–1 (figure 5A). The other pattern had a strong absorption band at 3380–3390 cm–1, with weaker bands at 3430–3450 cm–1 and 3640–3670 cm–1 (figure 5B); this was often observed in samples with green and yellow hues or black opaque samples. Some of the studied glass-ceramics had spectra that varied from these two patterns. The spectra for samples GC-35, GC-104, and GC-120 lacked the broad bands at 3430–3450 cm–1 and 3380–3390 cm–1. Sample GC-119 had a distinct spectrum, with only a broad band at ~3520 cm–1.
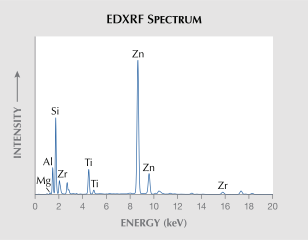
EDXRF spectra of the glass-ceramics displayed several visible bands consistently, confirming the presence of silicon, aluminum, magnesium, zinc, titanium, and zirconium (figure 6). Also detected were some additional elemental peaks corresponding to the color of the glass-ceramics: cobalt in blue samples, nickel in green, manganese and praseodymium in yellow, and neodymium and erbium in pink to red.
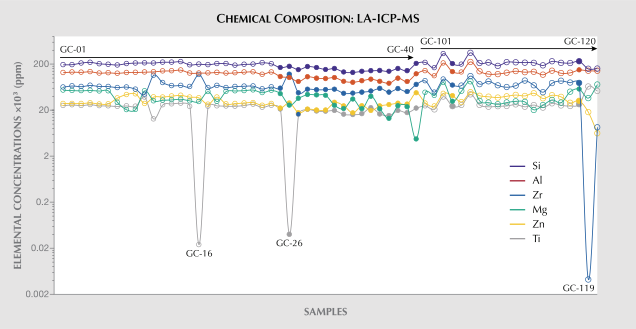
Analysis by LA-ICP-MS revealed a chemical composition mainly consisting of silicon (~36–44 wt.%) and aluminum (~22–34 wt.%) and other elements including magnesium, zinc, titanium, and zirconium. As shown in figure 7, a slight variation of each element concentration was observed in most of the glass-ceramic samples, regardless of color and transparency. A variety of elements, including rare earth elements (REEs) and transition metals, were also detected at lower concentrations (see supplementary table S2). Significant concentrations of sodium and hafnium were detected in every sample. Consistent with the EDXRF results, some minor to trace elements correlated with sample color, as they were present in higher concentrations in samples of similar color. Any other elements detected at much lower concentrations (i.e., less than 500 ppm or 0.05%) are assumed to be accidental contaminants and not additives during the glass-ceramic manufacturing process.
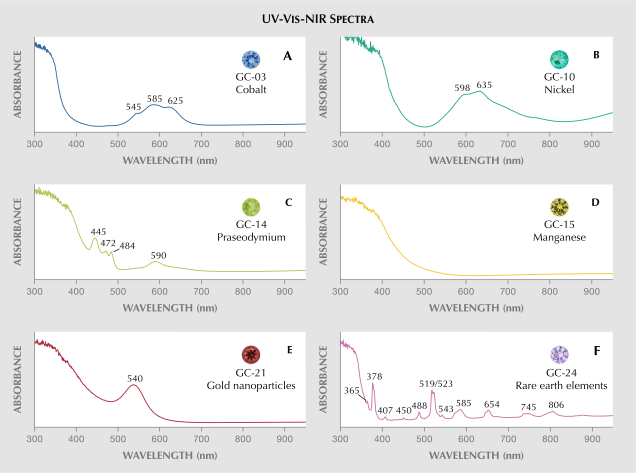
UV-Vis-NIR spectra collected in the 300–980 nm range showed consistent absorption features in transparent glass-ceramics of similar colors (figure 8). Blue glass-ceramics mainly displayed broad bands at approximately 545, 585, and 625 nm, with absorption edges between 340 and 400 nm (figure 8A). Green samples generally showed broad bands at approximately 598 and 635 nm, with an absorption increase above 870 nm toward the near-infrared region and absorption edges between 365 and 445 nm (figure 8B). The green-yellow and some yellow samples showed similar absorption bands at ~445, 472, 484, and 590 nm and an absorption edge at approximately 380–400 nm (figure 8C). Many yellow and yellow-orange glass-ceramics showed strong absorption from the UV region to the visible spectrum at 520–590 nm (figure 8D). The red samples predominantly featured an absorption band at approximately 540 nm (figure 8E), while the pink glass-ceramics exhibited several bands at ~365, 378, 407, 442, 450, 488, 519, 523, 543, 585, 654, 745, 800, 878, and 970 nm (figure 8F).
DISCUSSION
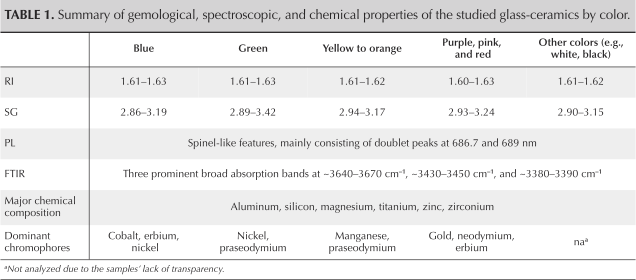
Characterization of Silicon-Aluminum-Magnesium-Zinc Glass-Ceramics. The glass-ceramic samples generally showed consistent results when tested with standard and advanced gemological methods (table 1). However, samples with different colors often exhibited distinct properties, depending on their respective color-causing elements.
Standard Gemological Properties. Glass-ceramics can be used to imitate a variety of natural gemstones, including citrine, peridot, emerald, tsavorite, topaz, tourmaline, spinel, sapphire, ruby, garnet, and kunzite. The separation of glass-ceramics from these natural stones is straightforward with standard gemological testing. Many of the natural stones have an RI outside the range of glass-ceramics (1.60–1.63); those with a similar RI are generally doubly refractive, unlike glass-ceramics.
Variations in the properties of glass-ceramics (RI and SG) can be attributed to slight differences in chemical composition. A higher concentration of heavier elements can result in a denser material, while certain additives in the glass phase can affect optical properties such as refractive index. Transparency also varies, depending on the size of the crystal grains in the glassy matrix. When the grain size is smaller than the wavelength of visible light, light is not scattered and the sample appears transparent. Above a certain size threshold, the crystals start to reduce transparency due to light scattering (Beall and Pinckney, 1999). This scattering effect caused by very small crystallites can be observed as hazy/milky clouds in transparent and translucent glass-ceramics, as well as a reddish appearance in semitranslucent samples viewed in transmitted light (Jin et al., 2023).
While the goal of producing glass-ceramic imitation gemstones is to create an inclusion-free material—and this is technically feasible—it is also entirely possible to purposely introduce flaws to make the material appear more natural.
PL Spectra. PL spectroscopy is a very sensitive technique (Eaton-Magaña et al., 2024) and can detect chromium at extremely low concentrations. The series of emission peaks between 670 and 730 nm shown in figure 4 closely resembles chromium emission peaks in spinel (Widmer et al., 2015; Chen et al., 2024), consistent with previous reports for blue to green glass-ceramics (Srisataporn et al., 2022).
Based on the main chemical composition of glass-ceramics in the silicon-aluminum-magnesium-zinc system (Beall and Pinckney, 1999; Höland and Beall, 2020), a spinel-like PL spectra observed in the samples matched the main crystalline phases present, which ranged from spinel to gahnite. Certain elements had a significant impact on the PL spectrum. For example, cobalt (figure 4C) and erbium (figure 4D) were associated with additional emission bands at 650 nm and 545–559 nm, respectively. Notably, glass-ceramic samples containing relatively high nickel concentrations (~2000 ppm and higher) tended to show weaker spinel-like PL features, with broad bands below 650 nm (figure 4B). High nickel concentrations can act as a quencher for the typical chromium photoluminescence in spinel (Jouini et al., 2007).
FTIR Spectra. In figure 5, prominent broad bands between 3300 and 3700 cm–1 appear to be associated with hydroxyl stretching of water molecules and silanol groups in glass (Faulques et al., 2001; Efimov and Pogareva, 2006). These bands could also be related to the vibrations of hydroxyl groups in spinel-group materials, which make up the main crystalline phases of the studied glass-ceramics. These FTIR features have been observed in annealed gahnite produced using hydrothermal growth (Miron and Grozescu, 2012), as well as spinel grown by flame fusion (figure 5D). The glass-ceramic samples from this study also showed a discernible band at ~2260 cm–1, caused by a combination of hydroxyl-group modes from the silica glassy matrix (Efimov and Pogareva, 2006).
FTIR spectra of natural glasses (e.g., moldavite and obsidian) and artificial glasses show a broad band around 3400–3600 cm–1, similar to the region seen in silicon-aluminum-magnesium-zinc glass-ceramics. However, the FTIR spectra of glass-ceramics are clearly different from those of glasses, lacking both peaks in the 3380–3450 cm–1 region. The distinctive FTIR signature of glass-ceramics can be used to separate them from natural and laboratory-grown gemstones, as well as natural and artificial glasses.
Major Chemical Composition. Most of the glass-ceramic samples contained silicon, aluminum, magnesium, zinc, titanium, and zirconium oxides. The presence of a combination of silicon, aluminum, magnesium, and zinc oxides is directly related to the glass that is ultimately crystallized primarily to spinel or gahnite crystal phases in the glassy matrix (Beall and Pinckney, 1999; Höland and Beall, 2020). Zinc oxide is a common additive in glassmaking to help reduce viscosity. This allows the glass to be poured into slabs, and it is important for fast, temperature-controlled transfer of the material. During the annealing phase, the zinc is included in the growth of the spinel-like phases through diffusion. Titanium and zirconium oxides are introduced as nucleating agents to promote uniform crystal growth (Höland and Beall, 2020). The right amount of titanium and zirconium oxides results in a homogeneous distribution of crystals growing throughout the material. Notably, hafnium was detected in every sample, with the amount of hafnium oxide at approximately 2 wt.% of the zirconium oxide content. This strongly suggests that hafnium is a contaminant in zirconium oxide (again, see table S2 in the supplementary material).
Color-Causing Agents and Notable Trace Elements. Coloration in glass-ceramics can be created by transition metal ions, REE ions, metal nanoparticles, or a combination of the three. For the samples from this study, color appearance and UV-Vis-NIR spectra (again, see figure 8) corresponded well with the minor to trace element compositions measured using EDXRF and LA-ICP-MS. Glass-ceramics can be colored by various dominant elements, as follows:
- Blue: Cobalt was the primary cause of blue coloration. The blue samples had a typical cobalt UV-Vis-NIR absorption spectrum, with three broad absorption bands between 540 and 650 nm (Shen, 2010; D’Ippolito et al., 2015). This was consistent with the significant cobalt concentrations detected.
- Green: Nickel was responsible for light blue to green colors in many of the samples. A considerable nickel concentration was measured in these samples, which corresponded with two broad UV-Vis-NIR absorption bands between 590 and 640 nm (Shen, 2010; Jollands et al., 2023). Praseodymium, another chromophore detected, also contributed a green hue, with a unique UV-Vis absorption spectrum in the 440–600 nm range (Khomenko et al., 2017).
- Yellow to Orange: Yellow to orange coloration in the samples was generally created by manganese (Bosi et al., 2007). Strong absorption in the UV and blue regions below ~550 nm was observed in yellow samples, while strong absorption extended to ~610 nm to produce orange colors in samples with higher manganese concentrations. Praseodymium also contributed to a yellow-green coloration.
- Purple, Pink, and Red: Many gem materials with pink to red coloration would be expected to show similar absorption patterns with different absorption intensity—weaker for pink and more intense for red colors. This is not the case for pink to red glass-ceramics, however. Two main groups of chromophores were found in the samples within this color range:
- REEs, including neodymium and erbium, created a pinkish hue. REEs typically showed multiple narrow absorption peaks in the UV-visible region (Khomenko et al., 2017), consistent with the presence of these elements at high concentrations.
- Gold nanoparticles in the glassy matrix resulted in a strongly saturated red color. The UV-Vis absorption caused by gold nanoparticles has a characteristic absorption spectrum defined by a broad absorption band at ~540 nm (figure 8E) (Alex and Tiwari, 2015). In this study, the red glass-ceramics colored by gold nanoparticles had gold concentrations around 20–40 ppm.
Multiple chromophores can be combined to produce a range of colors. Several other elements were detected in this study, but they are not known as chromophores (e.g., calcium, barium, sodium, lead, tin, and arsenic). Some of these elements, such as sodium and arsenic, are known additives in the glassmaking process to adjust viscosity, but they might also be contaminants from other compounds.
Comparison Between Optical Glasses and Their Glass-Ceramic Products. Three optical glasses (OG-01 to OG-03) that would ultimately produce blue, red, and green glass-ceramics after controlled crystallization (table 2) were also examined. The differences in RI and SG values before and after crystallization were insignificant. In addition, the optical glasses and the glass-ceramics both showed a stronger chalky green-yellow fluorescence reaction to short-wave UV than to long-wave UV. These similarities indicate that standard gemological testing alone is not sufficient to differentiate optical glass from glass-ceramic products.
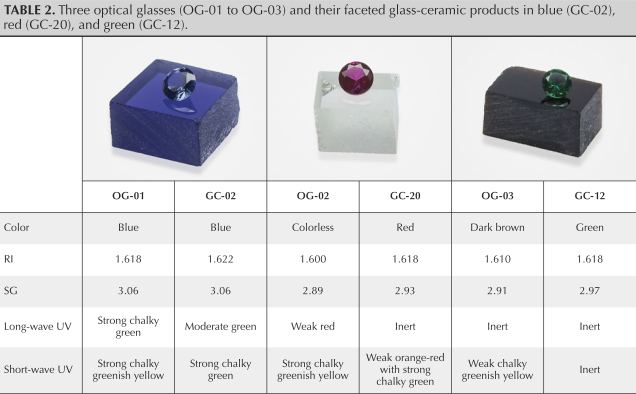
As shown in table 2, optical glasses can either resemble the final color of the glass-ceramic products, or the final color can be altered through a post-growth annealing process. For the blue optical glass (OG-01) and the blue glass-ceramic material (GC-02), a combination of cobalt and erbium was added to produce a blue hue. Co2+ is known to create blue coloration when incorporated in glass phases (Calas et al., 2021), so the color difference between the blue optical glass and the blue glass-ceramic product was insignificant.
Meanwhile, a significant color difference was observed between the near-colorless optical glass (OG-02) and its red glass-ceramic counterpart (GC-20), as well as between the dark brown optical glass (OG-03) and its green glass-ceramic counterpart (GC-12). The shift from near-colorless optical glass to a red glass-ceramic was due to the precipitation of gold nanoparticles with the presence of tin (Tilley, 2011; Calas et al., 2021). Nano-scale gold particles that developed next to the crystalline phases (e.g., spinel/gahnite) qualify the red sample as a glass-ceramic (Deubener et al., 2018). The dark brown optical glass contained a significant nickel concentration. When the optical glass was converted to a glass-ceramic, the nickel became incorporated into the spinel/gahnite-like crystalline phases, producing a green color. This determination that the nickel was incorporated into the spinel/gahnite crystalline phases is based on the UV-Vis-NIR absorption spectrum of green glass-ceramics (again, see figure 8B; e.g., Jollands et al., 2023).
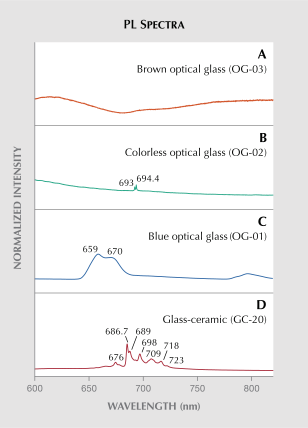
Since the conversion of optical glasses to glass-ceramics requires no additives, chemical analysis using EDXRF and LA-ICP-MS showed no change in composition. In contrast, the FTIR (again, see figure 5) and PL (figure 9) spectra of the glass-ceramics displayed a significant shift from that of the optical glasses. These differences are related to the development of desired crystalline phases after controlled heat treatment.
As shown in figure 9, the glass-ceramics had a set of emission peaks between 670 and 730 nm that resembled spinel/gahnite PL features but were absent from the optical glass. Over the 650–750 nm range, the brown optical glass exhibited no emission peaks; the colorless optical glass showed narrow doublet peaks at 693 and 694.4 nm, similar to the Cr3+ emission peaks in corundum (Powell, 1998). The blue optical glass exhibited broad bands at around 659 and 670 nm, possibly related to REEs such as erbium. Although the corundum PL feature was detected in the colorless optical glass, this material is not considered a glass-ceramic, as corundum phases in this stage likely resulted from uncontrolled spontaneous crystallization.
CONCLUSIONS
Glass-ceramic materials can be produced in a broad range of colors and transparencies to imitate a wide variety of natural gemstones. Their gemological, spectroscopic, and chemical properties are generally consistent and can be used to distinguish glass-ceramics of the silicon-aluminum-magnesium-zinc system from natural and laboratory-grown gems as well as glass imitations.
The transparent glass-ceramic material currently being produced for gem use is inclusion-free, but manufacturers may eventually introduce flaws to more closely resemble natural stones. However, accurate identification can be achieved through a combination of standard and advanced gemological methods.
The proposed identification criteria for silicon-aluminum-magnesium-zinc system glass-ceramics are an RI between 1.60 and 1.63; a chemical composition dominated by magnesium, aluminum, silicon, titanium, zinc, and zirconium; spinel-like PL features; and a unique FTIR feature with a broad absorption band at ~3640–3650 cm–1, together with bands at ~3430–3440 cm–1 and/or ~3380–3390 cm–1.
It is important to note that these criteria are only valid for glass-ceramics of the silicon-aluminum-magnesium-zinc system. Creation of glass-ceramics in other chemical composition systems is possible, which could result in different gemological, spectroscopic, and chemical properties.
Dr. Wasura Soonthorntantikul is a senior research scientist at GIA in Bangkok. Wim Vertriest is the manager of field gemology at GIA in Bangkok. Dr. Karen Avakyan is the founder of the Formica Group companies and holds patents on the use of glass-ceramics in jewelry.
Dr. Wasura Soonthorntantikul is a senior research scientist at GIA in Bangkok. Wim Vertriest is the manager of field gemology at GIA in Bangkok. Dr. Karen Avakyan is the founder of the Formica Group companies and holds patents on the use of glass-ceramics in jewelry.